A client recently asked me how we’ll know if our SEO efforts are on track after just a month and I knew exactly what to say. But it wasn’t always like this.
I’ve been there—overwhelmed by data and scrambling to prove the value of my work. That’s why I now focus on select SEO metrics that clients see returns from their investments.
In this article, I’m spotlighting the 16 most vital SEO KPIs I monitor to keep client sites on course for search visibility, traffic growth, and bottom-line business goals. Based on my experience, I’ll share why each metric matters and provide tips on how to track it. Let’s begin.
Speed up your organic growth journey
Find out how we use content, strategy, and SEO to build your authority and drive your business forward.
Leading vs. lagging indicators
SEO KPIs fall under two categories: leading and lagging indicators. Monitoring both types gives you a complete picture of your SEO efforts and lets you make informed decisions about where to focus your optimization efforts for maximum impact.
I like to think of leading and lagging SEO indicators like driving a car.
Leading indicators are my dashboard—rankings, backlinks, traffic. They give me real-time alerts about performance and let me course-correct before issues arise. It’s like filling up the tank when the fuel light comes on.
Lagging indicators, like conversions, are my destination arrival time. They tell me if my past SEO work got me to my goal, but not the route I took or the speed I traveled. I know I’ve arrived, but I don’t have details on the journey.
In my experience, you need to watch both the dashboard and the clock. Monitor leading and lagging KPIs together for a complete picture to keep your SEO on track and get to your target on time.
8 leading indicators to track
I’ve categorized the SEO KPIs into three groups: visibility and authority, brand awareness, and engagement. Tracking leading indicators across these areas allows you to fine-tune your tactics before they impact lagging KPIs.
Let’s summarize eight essential leading SEO KPIs that provide a comprehensive view of your organic search performance.
Keyword Rankings
Volume of Keywords
Impressions
Non-Branded Clicks
Organic CTR (Click-Through Rate)
Organic Visibility
New Backlinks
Core Web Vitals
1. Keyword rankings
KPI Category: Visibility and Authority
A website’s keyword rankings, particularly for terms you’re specifically targeting and tracking, are a key leading indicator of SEO performance.
I used to mistake rankings as the ultimate SEO metric, but they’re really a means to an end—a leading indicator of potential traffic and conversions. Strong rankings don’t guarantee success, but they do suggest I’m on track to earn more organic visibility and clicks.
By monitoring your site’s organic positions for core keywords—especially those in the top 10 results—you can assess your current search visibility and identify opportunities to drive more traffic. An upward movement in rankings for priority keywords signals that your optimization efforts are heading in the right direction.
The higher the ranking, the more likely your target audience will find you on search results. And if you manage to snag the first spot on the search engine results page (SERP), even better—the first organic result in Google Search has an average click-through rate of 28.5%.
This translates to increased organic traffic, higher click-through rates and ultimately, more conversions and revenue for your business. High rankings also enhance brand visibility and credibility, as users often perceive top-ranked sites as more authoritative and trustworthy.
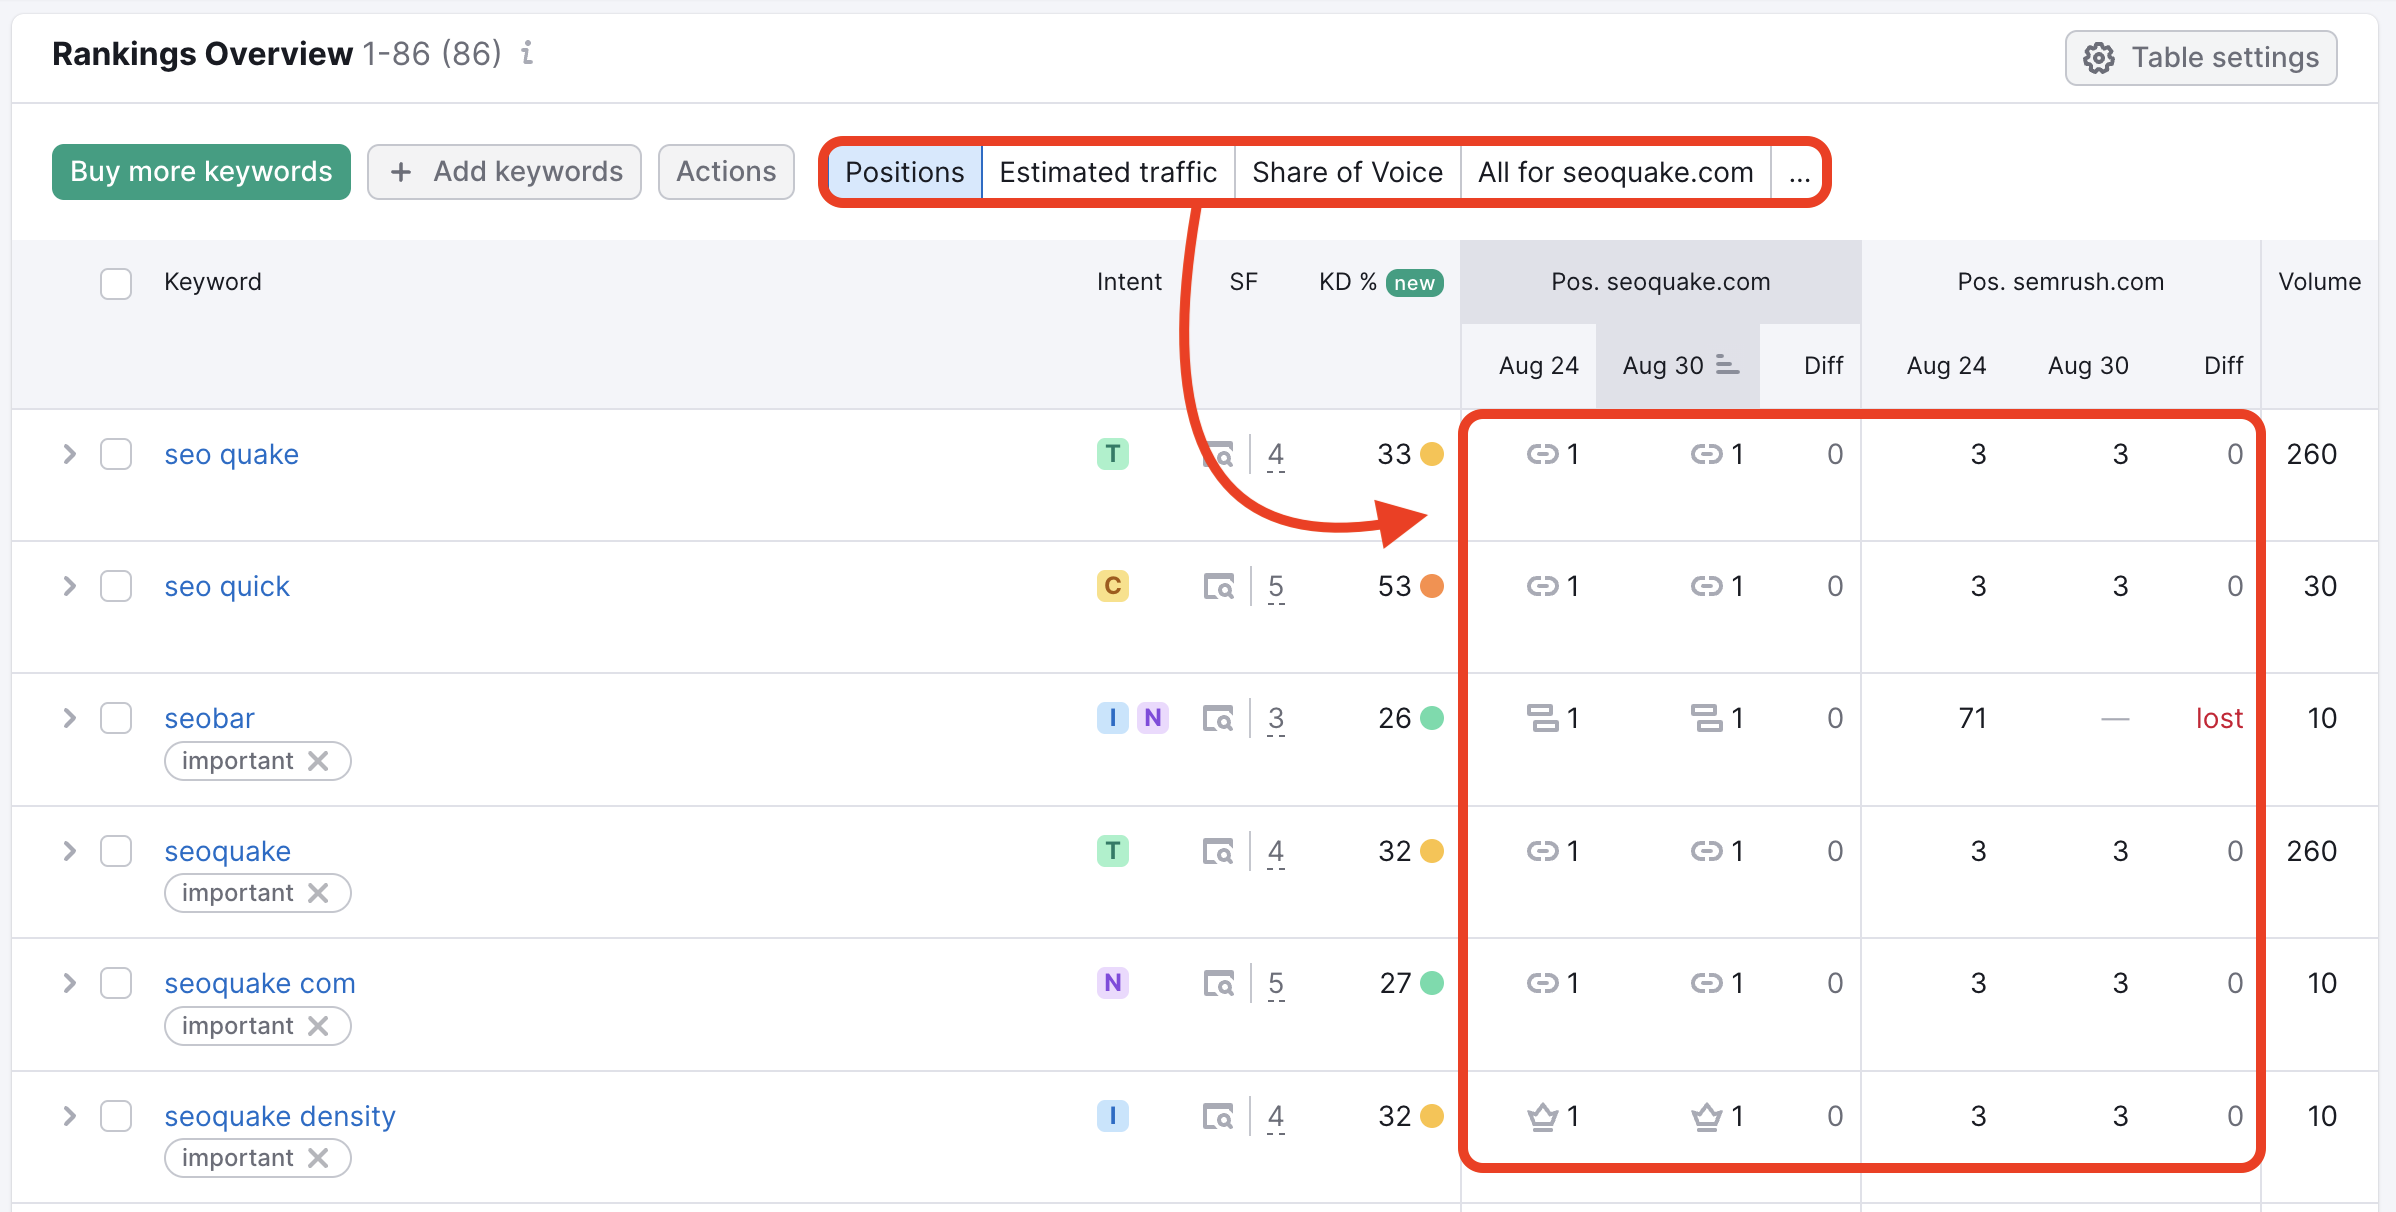
I track my website’s keyword rankings across various search engines in real-time with Semrush’s Position Tracking tool. Here’s an overview directly from Semrush on what it looks like:
I get detailed reports and insights into my keywords’ performance to identify underperforming pages on my website, pinpoint exact keywords where I’m losing ground to competitors, and discover new long-tail keywords gaining popularity among my target audience.
Alternatively, Flying Cat swears by Ahrefs to track their client keywords. It’s another powerful tool that offers comprehensive keyword data and intuitive visualizations.
Both tools are great—it’s just about finding the one that fits your specific needs and workflow best.
Focusing on improving rankings for priority keywords while also optimizing content for a broader set of relevant search queries maximizes your website’s visibility and search traffic.
2. Volume of keywords
KPI Category: Visibility and Authority
The volume of keywords refers to the total number of keywords your website ranks for in search engine results.
As you create more relevant, high-quality content, you should see an increase in the number of keywords you rank for over time. This is especially important to track in the early days, as it’s a key indicator you¡re going in the right direction.
Monitoring the volume of non-branded keywords you rank for is particularly important—Seeing growth in non-branded keyword rankings is an early indicator that your SEO efforts are moving in the right direction and you’re gaining visibility for topics beyond just your brand.
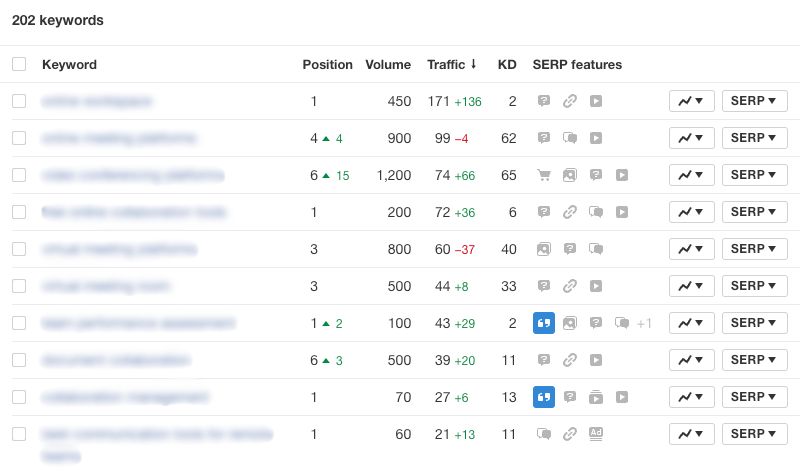
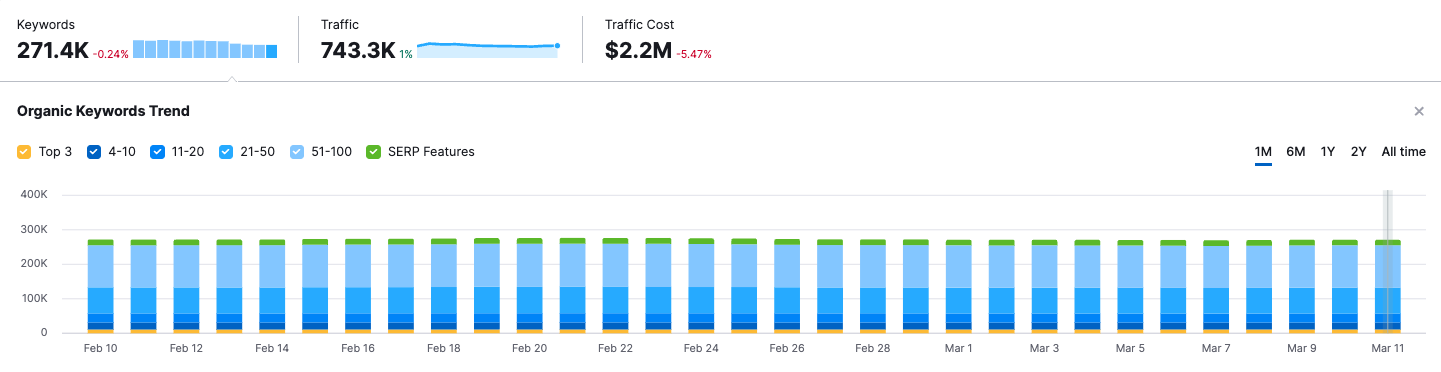
The “Positions” tab in Semrush’s Organic Research tool lets me see the keywords a page ranks for. For example, here’s how many keywords the homepage of a client’s website ranks for and what the trend is like:
Keep an eye out for rising query volumes among lower competition keywords as this presents a chance to establish authority around growing, less saturated topics. Incorporating search volume context helps create an SEO strategy keyed into visibility and market interest signals for core keyword targets.
3. Impressions
KPI Category: Visibility and Authority
Impressions are the number of times your web pages are seen in the search results, even if searchers don’t click through to your site.
Tracking impressions over time reveals trends in your overall search visibility. If impressions rise for target keywords, your content is showing up more often for relevant queries—a clear sign your SEO is working to boost search presence.
More impressions mean more potential for clicks and customers. Monitoring this metric identifies areas for improvement to earn better SERP rankings for priority keywords.
I personally love using Semrush’s Organic Traffic Insights tool for more advanced analysis. Here’s what the dashboard looks like:
What’s great about it is that it integrates impression data with all the other powerful features in Semrush. I can easily take my insights from this tool and plug them into other areas of the platform.
The team at Flying Cat uses Google Search Console. It’s a free tool that provides impression data straight from the source, since Google is reporting on searches happening on their own platform.
Search Console is accurate and reliable, making it a great way to keep a pulse on your search visibility without investing in paid tools right off the bat.
As your SEO efforts grow, you may want to explore tools like Semrush or Ahrefs. But for most website owners, Search Console offers plenty of valuable insights to track this key metric.
While impressions give a directional understanding of visibility, they don’t directly correlate with traffic or conversions.
As Google’s John Mueller notes, impressions “are not necessarily all the impressions shown to all users. It’s not the search volume.” Even top-ranked pages aren’t shown to every searcher.
When analyzing impressions, I break it down by:
Page: Which pages earn the most (or least) impressions?
Keyword: Which terms drive impressions?
Device: Are impressions from desktop, mobile, or tablet?
Location: Where are searchers located?
I set goals to increase impressions month-over-month as I optimize my site. Comparing my impression share to competitors’ also shows me where I stand.
Impressions alone don’t tell the full story though. I connect them to other key metrics, especially rankings:
Impressions & rankings up? My SEO is working!
Impressions down & rankings dropping? Time to investigate.
Impressions up but rankings down? My titles & descriptions may need work.
Steady visibility gains mean I’m on the right track, so while impressions are just one piece of the puzzle, they’re a powerful leading indicator of SEO progress.
4. Non-branded clicks
KPI Category: Brand Awareness
Non-branded clicks refer to organic search clicks generated from keywords that do not include your brand name or trademarks. For example, “best espresso machine” rather than “Nespresso’s espresso machine.”
Non-branded clicks show your website’s popularity beyond your brand name. The more non-branded clicks you get, the more it shows your content is valuable and trusted in your industry.
But you’ll also notice that when a website has not invested in SEO at all, most of its clicks are branded and it has a very high conversion rate—this tells me it doesn’t really get its business from search.
A healthy ratio of branded to non-branded clicks depends on factors like industry and brand awareness, but a general rule of thumb is that non-branded clicks should account for at least 60-70% of your total organic traffic. If your branded clicks are higher than this benchmark, it shows that you have room to improve your non-branded SEO efforts and attract more new visitors through search.
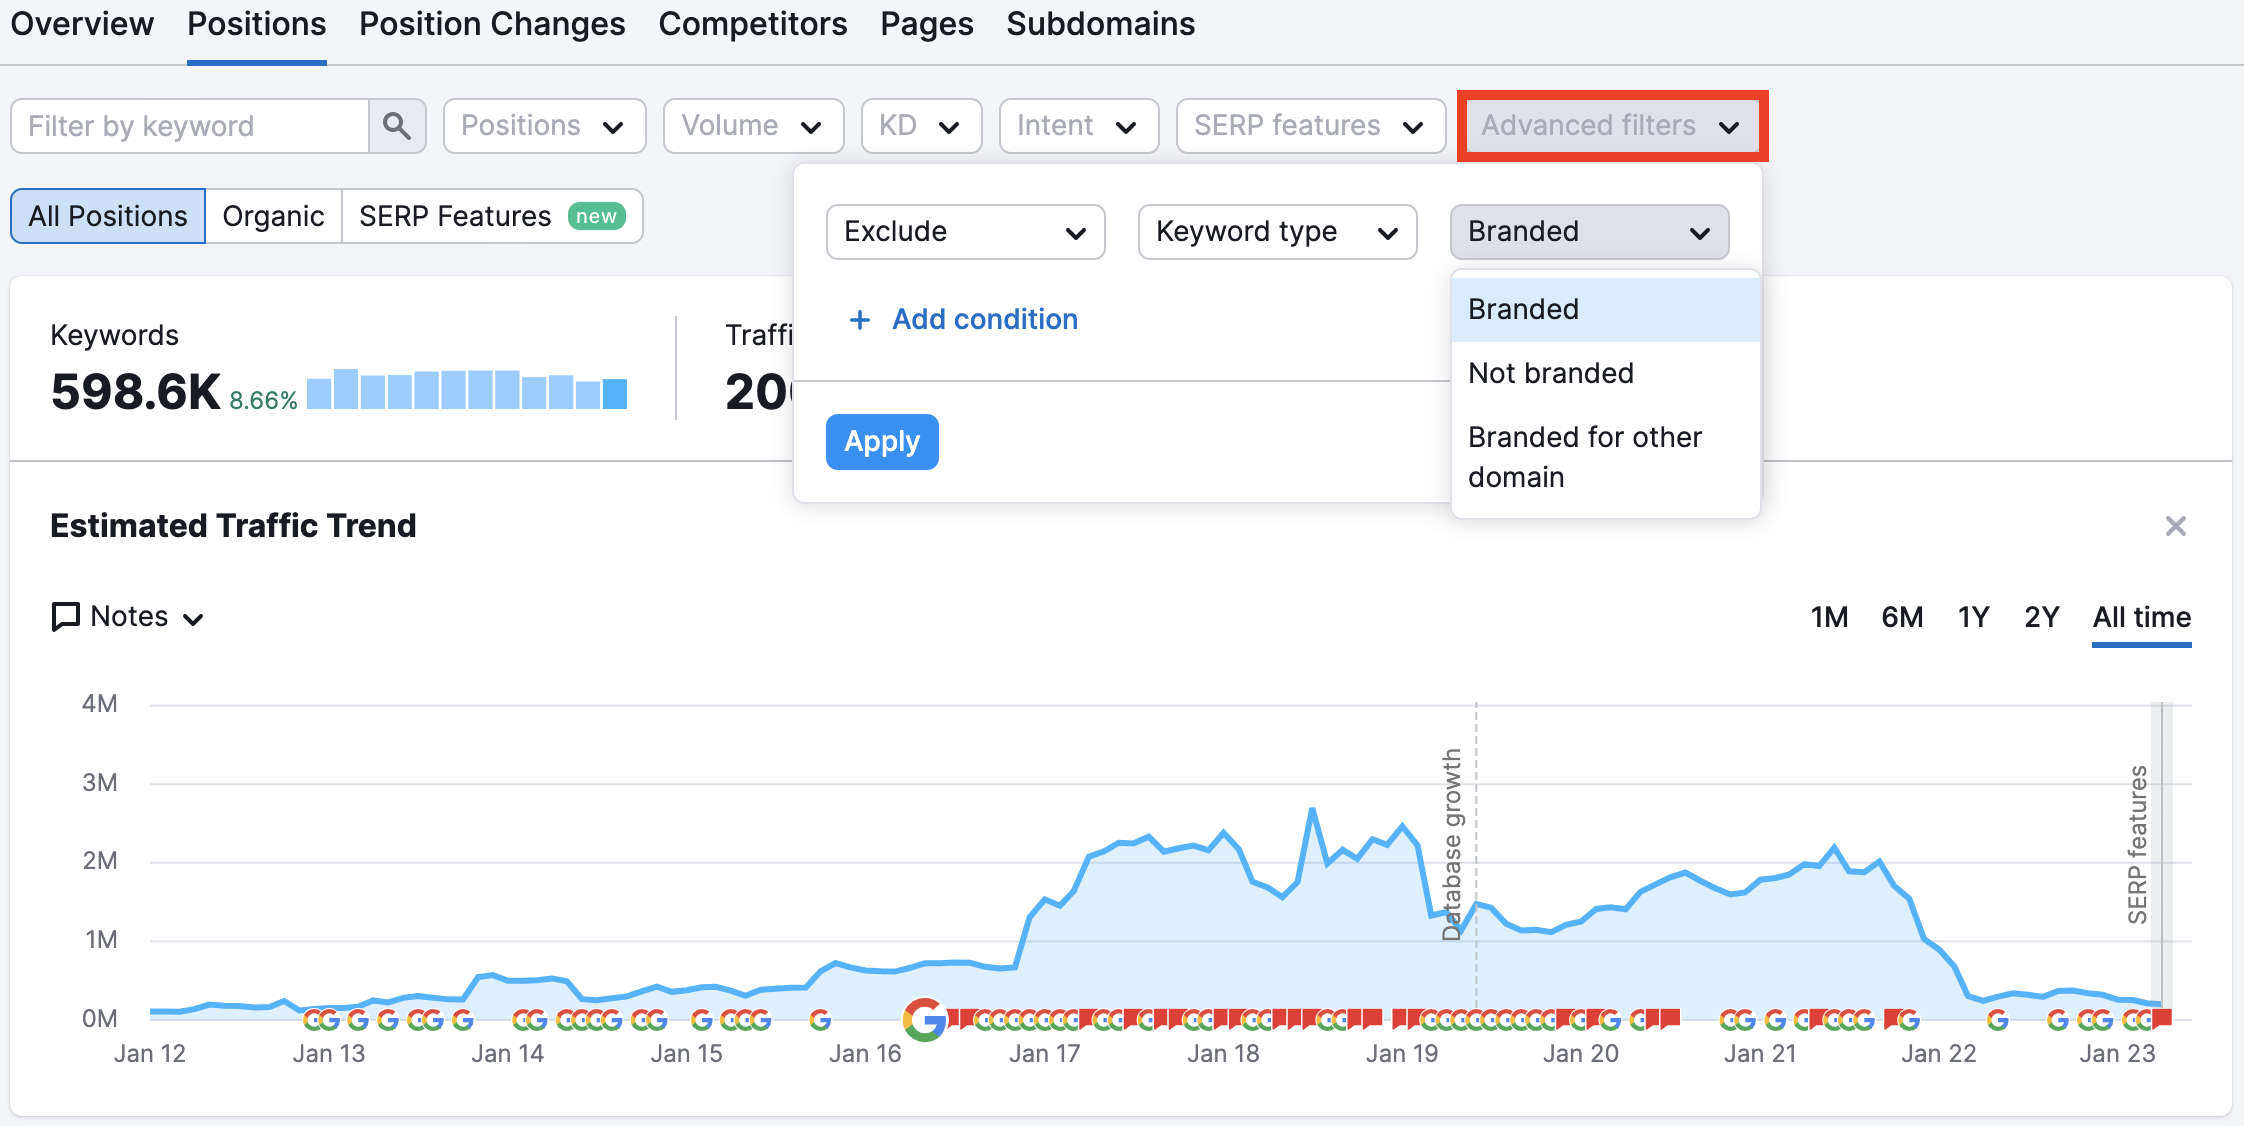
Semrush is my go-to for this. I can filter Branded and Non-Branded keywords in the Organic Positions and Position Changes reports.
GSC is a great way this too. You can create custom filters to segment branded and non-branded traffic and analyze each subset separately. While it takes a bit more legwork than Semrush’s automatic split, GSC lets you dive deep into granular data by page, query, device, and more.
Focusing on growing non-branded clicks expands your reach, attracts new leads, and supports your overall marketing goals by establishing your brand as a trusted resource for your target audience—even if they don’t know your name yet.
5. Organic CTR (click-through rate)
KPI Category: Visibility and Authority
Organic click-through rate (CTR) measures the percentage of searchers who click through to your website from the search engine results pages after conducting a query. The formula to calculate CTR is:
(clicks / impressions) x 100.
While I wasn’t sure whether to categorize this as a leading and lagging indicator, I think it fits leading better since it directly influences future outcomes, like website traffic and conversions. CTR is a KPI you can quickly improve for better results by optimizing your metadata to make your search listings more compelling.
Research from Backlinko highlights that top-ranking positions heavily influence CTR— with the #1 result generating around 10x more clicks than the #10 slot. But CTR can vary significantly based on search intent, SERP features, ad placements, and constantly evolving ranking algorithms.
Rather than fixating on aggregate website CTR, which provides little actionable insight, analyze and optimize CTR at the page and query level.
Aggregate CTR can be misleading because it includes every keyword your site has ever appeared for, even if it’s irrelevant to your business or SEO strategy. This makes your overall CTR seem much lower than it really is for the terms and topics that matter most.
Plus, as you add new pages to your site, they likely won’t rank well right away, which can drag down your average CTR across the board. I find it tough to get a true sense of how well my established pages are performing in the search results.
Insteady, identify pages and target keywords with below-average CTRs compared to their ranking positions. This could signal issues like poorly optimized title tags/meta descriptions that fail to entice clicks.
Here’s my approach to organic CTR data from Google Search Console:
I analyze CTR alongside rankings and traffic to diagnose SEO performance. If a page ranks well but has low CTR, I know the content or UX may not meet user expectations. I’ll optimize the page to align with searcher intent and boost engagement.
Consistent CTR improvements tell me my optimizations are working to increase visibility and qualified traffic. I use GSC data to spot high-performing pages and replicate their UX and content structure.
6. Organic visibility
KPI Category: Visibility and Authority
Organic visibility is how easily people can find your website when they search for related topics on Google or other search engines.
It can be a tricky concept because different SEO tools define it in different ways.
Ahrefs calls it “share of voice”—the percentage of clicks your website gets compared to the total clicks for tracked keywords. If 100 people search keywords you track and 20 click your site, your share of voice is 20%.
I like to think of it like a pie chart. The whole pie represents all the clicks for your tracked keywords. Your visibility is the size of your slice compared to the rest of the pie.
Semrush, on the other hand, defines visibility as “how likely it is for users to see and click on your website in organic search results.” They say it increases the more keywords you target and the higher you rank for them.
So in the pie analogy, SEMRush’s visibility would be more like the total size of your pie (the number of keywords you track) and how big your slice is on average (your rankings).
I prefer Ahrefs’ definition because it’s easier to visualize. Knowing the percentage of clicks you’re capturing paints a clearer picture of your organic presence compared to competitors.
But whichever definition you use, organic visibility measures how well your website shows up and gets clicked on in search results. The higher your visibility, the more likely searchers will find and visit your site.
Traditionally measured by ranking positions within the classic “10 blue links”, organic visibility now includes diverse SERP features like knowledge panels, local packs, and rich results that drive user attention.
As search results become visually rich, achieving maximum organic visibility requires optimizing for these SERP features in addition to the pursuit of top 10 rankings.
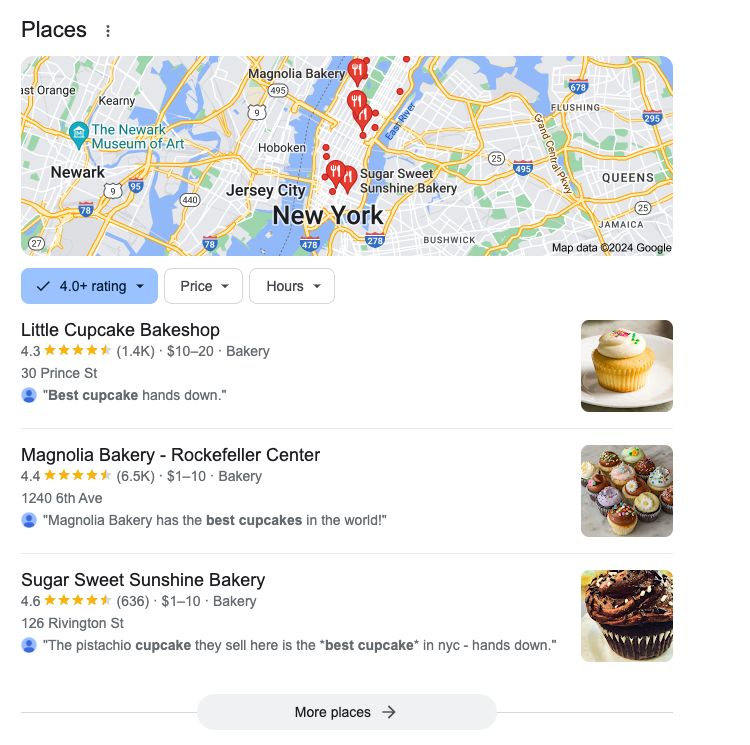
For example, say you run a local bakery. Previously, you might have focused on ranking in the top 10 results for keywords like “best cupcakes in NYC.”
But now, Google often shows a “local pack” at the top of the results page featuring a map and listings for nearby businesses like this:
If you’re not optimized for this SERP feature, you could miss valuable visibility and clicks.
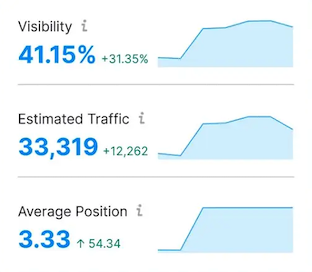
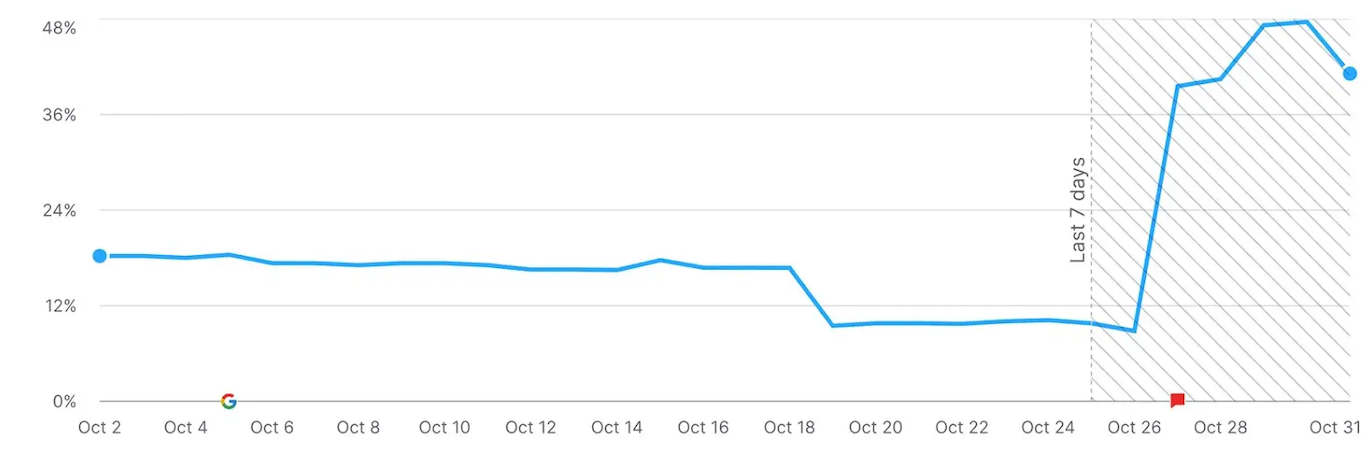
I use Semrush’s Position Tracking tool to track the visibility. Here’s what it looks like in the “Landscape” tab.
If I want more granular data, I can go to the “Overview” tab to see changes over time.
Total impressions data shows how often your site appears in search results, but organic visibility measures your share of available clicks compared to competitors for target keywords.
At the same time, click data adds critical context around which SERP positions and features translate visibility into engaged traffic.
Instead of obsessing over specific ranking positions, I maximize my overall presence in the search results. That means optimizing not just for the traditional “10 blue links,” but for all the SERP features that can drive qualified traffic—like featured snippets, People Also Ask boxes, and local packs.
This integrated strategy leads to more sustainable SEO success, letting me capture search visibility and drive qualified traffic even if my ranking for a particular keyword drops.
7. New backlinks
KPI Category: Visibility and Authority
Backlinks are incoming links to a webpage from an external website. They act as votes of confidence similar to someone credible vouching for and recommending your business to new potential customers.
Backlinks remain one of Google’s top ranking factors. The more high-quality backlinks you have, the higher your website ranks.
When actively building links through email outreach or guest blogging, track:
Number of links earned
Number of links lost
Total number of backlinks
Total number of referring domains
These link metrics provide insight into campaign progress and performance.
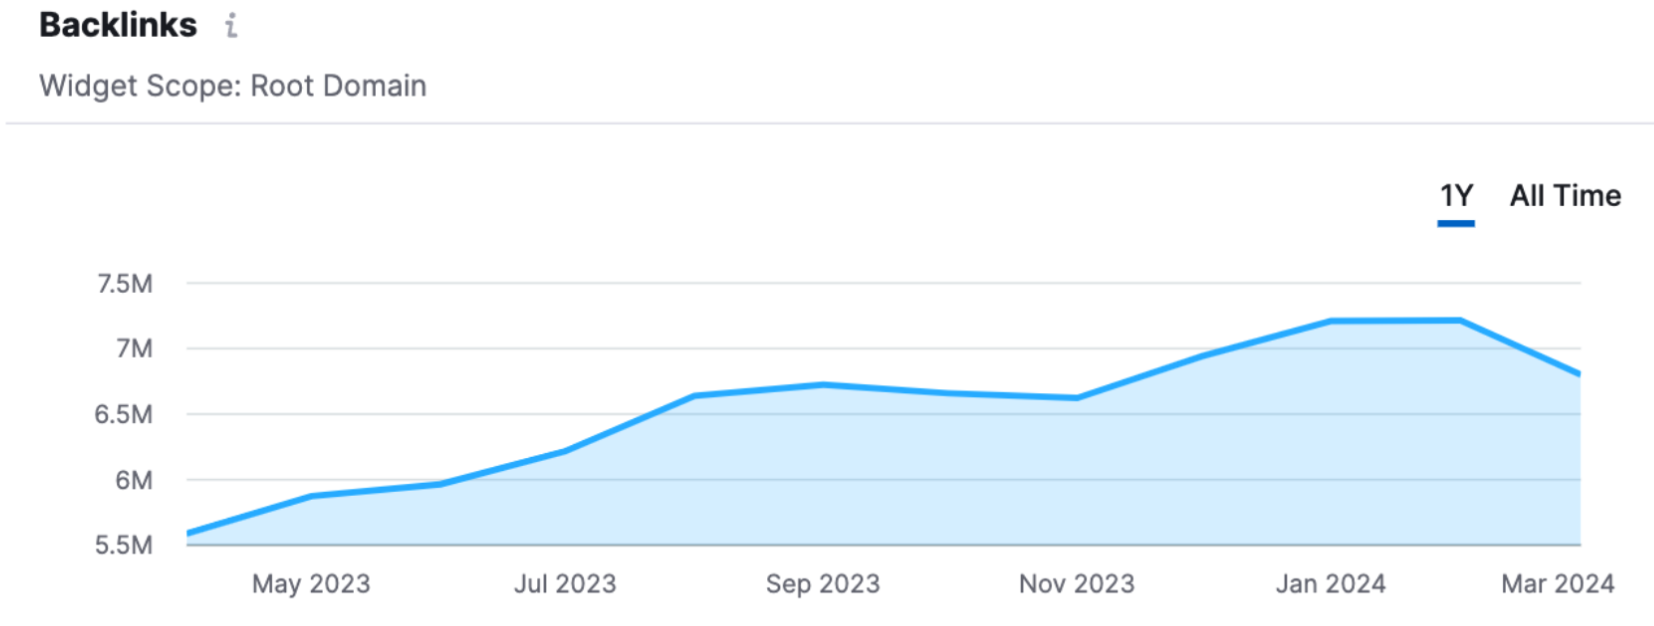
Semrush’s Backlink Analytics tool allows you to monitor backlink growth over set time frames.
All you need to do is enter your URL and you get a bunch of backlink data, like referring domains, new and lost backlinks, and, of course, backlink growth:
Backlink growth is a leading indicator of organic success because it shows your site is earning authority and relevance. Each new link signals to search engines that others find your content valuable.
Tracking new backlinks and referring domains over time gauges the impact of your link building and PR. A steady increase in high-quality links indicates your content resonates and your brand is gaining online traction.
Backlinks also drive referral traffic and brand awareness, exposing your site to new audiences. So backlink growth supports broader business goals like increasing market share and revenue.
I use tools like Ahrefs or Semrush to monitor backlink growth, focusing on link quality and relevance. I also compare my backlink profile to competitors to spot gaps and opportunities.
Tracking this leading indicator ties link building to SEO results and keeps stakeholders bought in. Steady backlink growth predicts rising rankings, traffic, and business success.
8. Core Web Vitals
KPI Category: Engagement-Oriented
Core Web Vitals (CWV) include three technical SEO metrics essential for assessing a website’s speed and user experience: Largest Contentful Paint (LCP), First Input Delay (FID), and Cumulative Layout Shift (CLS). These metrics evaluate the speed, responsiveness, and visual stability of your web pages.
💡 While providing a good user experience is important, it’s worth noting that manipulating CWV metrics likely has the least impact on SEO compared to other factors. Achieving “good” CWV scores can support your SEO efforts, but it shouldn’t come at the expense of creating great content, earning valuable links, and increasing overall relevance. Strike a balance between technical optimizations and the big-picture strategies that move the needle.
But how does CWV relate to SEO KPIs?
Here’s an example: I had an e-commerce client with great content but a slow, clunky site. Users were bouncing before seeing what they offered.
By improving Core Web Vitals—faster load times, better responsiveness, less layout shifts – we created a superior user experience. And their SEO KPIs followed suit.
Rankings, organic traffic, and conversions increased as users and search engines recognized the site’s enhanced performance.
So while CWV may not be the top SEO factor, they definitely impact key metrics. It’s like building a product – a great product needs great UX. Users won’t tolerate delays or poor performance.
Some tips on tracking CWV:
Use Google’s PageSpeed Insights for comprehensive reports on CWV for specific pages.
Check Google Search Console’s Core Web Vitals report to identify pages that need improvement.
Set up alerts in Google Analytics for significant changes in CWV metrics.
Review and optimize at least once monthly based on CWV insights.
8 lagging indicators to track
In this section, I highlight 8 lagging indicators categorized into revenue, brand awareness, engagement, and local SEO. These KPIs measure financial health, audience recognition, customer interaction, and local search visibility.
Monitoring these indicators doubles down on strengths and weaknesses, enabling data-driven optimizations to improve business performance.
Branded Clicks
Conversion Rate
Cost Per Acquisition (CPA)
Content Efficiency
User Engagement
Revenue from Search
Customer Lifetime Value (CLV)
Google Business Profile Data
1. Branded clicks
KPI Category: Brand Awareness
Branded clicks refer to organic search sessions generated from users searching for your company, product, or brand name keywords.
Branded clicks are a lagging SEO indicator because they typically increase as a result of your overall SEO efforts. People who discover your brand through non-branded searches may later seek you out directly and boost your branded click volume over time.
High-branded traffic isn’t necessarily an indication of successful SEO. Visitors searching brand terms likely already know your business. The key is driving new awareness from non-branded discovery.
Still, monitoring branded clicks provides useful context on the health of your overall brand presence. As you grow your SEO efforts and start attracting traffic, you’ll likely see a corresponding increase in branded searches as well. Instead, analyze branded and non-branded clicks side-by-side to isolate the SEO value driven specifically from rankings improvements.
If non-branded clicks grow while branded clicks remain flat, your content targeting informational searchers is likely resonating.
Branded clicks help size the loyalty pie—non-branded clicks show how much that pie expands through organic discoverability gains.
2. Conversion rate
KPI Category: Revenue
Conversion rate is the percentage of website visitors that complete a desired goal action—from downloads to purchases and everything in between. They indicate the business ROI from SEO by quantifying user engagement levels.
Conversion Rate (%)=(Total Number of Visitors/Number of Conversions)×100
Segment conversion rates into marketing qualified leads (MQLs) and sales qualified leads (SQLs) to gain more granular insights.
MQL conversion rates
MQL conversion rates refer to micro-conversions like newsletter signups or content downloads. Tracking MQL conversion trends over time shows how well your content resonates during initial research stages. Analyzing micro-conversion rates helps you understand how well your SEO content captures attention and drives the first critical touchpoints across the buyer’s journey.
SQL conversion rates
SQL conversion rates cover online conversions tied directly to revenue, such as demo requests, free trials, sign-ups, or purchases. Analyzing SQL rate improvements shows how well your SEO is at driving sales.
By dividing conversion rates into MQLs and SQLs, you can connect SEO efforts to top-funnel and bottom-funnel business results respectively. This enables data-backed ROI measurement and optimization of SEO for both visibility and viability objectives.
3. Cost per acquisition (CPA)
KPI Category: Revenue
Cost per acquisition (CPA) is a critical lagging SEO KPI that evaluates efficiency by revealing how much you spend driving an email signup, content download, sale, or other conversion.
As an outcome metric, CPA confirms the ROI payoff from your SEO efforts and content strategy.
Here’s how you calculate your CPA:
CPA=Total Cost of SEO (agency costs, content, SEO tools, headcount, etc.) / Conversions
Watch CPA over time—declining values for priority conversions signal increasing ROI efficiency from ongoing optimization. Segment CPA by marketing qualified leads vs sales qualified leads.
While lower CPAs represent positive ROI, balance this data point against conversion volume and revenue trends to avoid over-optimizing at the expense of top-line growth. If CPAs drop but conversion totals remain flat, revisit segmentation and attribution to ensure you capture the full SEO value being created.
4. Content efficiency
KPI Category: Engagement
Content Efficiency measures how much value you’re getting from each piece of content on average. It spotlights if your content is delivering the expected ROI in terms of traffic, leads, or revenue.
Rather than looking at the percentage of pages that meet a specific goal, I see Content Efficiency as the average outcome per page, measured across my entire site. For example, if I have 100 pages that collectively generate 10,000 visits per month, my Content Efficiency would be 100 visits per page.
Tracking this metric over time helps me gauge whether my content is becoming more or less effective at driving results.
If I see my average traffic or conversions per page dip, I know I need to focus on optimization before creating new content. On the other hand, if my Content Efficiency is steadily rising, it’s a good indicator that I’m ready to scale my efforts and invest in more content production.
This holistic view helps me make strategic decisions about resource allocation. Rather than getting bogged down in the performance of individual pages, I can keep my eye on the big picture and ensure my content strategy is moving in the right direction.
Content Efficiency has a huge impact on the cost-effectiveness of my content strategy. When it’s high, it means I’m getting more bang for my buck—every dollar I invest in content goes further towards driving my business goals.
5. User engagement
KPI Category: Engagement
GA4 defines an “engaged session” as one lasting over 10 seconds, including a conversion event, or having 2+ pageviews or screenviews. Engagement rate is the percentage of total sessions meeting this criteria—basically the opposite of bounce rate.
When I first started tracking engagement in GA4, I wanted to understand exactly how it was measured and what it meant for my SEO. So, I ran experiments on my own site, setting up different scenarios and watching how the metrics responded.
Trial and error helped me realize engagement boiled down to meaningful interaction. It wasn’t just about time on the page but about taking action—clicking to another page, watching a video, filling out a form, etc. The more I encouraged active participation, the better my engagement rates looked.
This metric has gained buzz since Google’s 2023 antitrust suit revealed they heavily rely on user signals like engagement to determine content quality. Google admitted they “don’t understand documents, [they] fake it. If [they] get a positive reaction, [they] figure it’s good.”
So engagement isn’t just important for UX – it’s critical for SEO. By captivating visitors, you show Google your pages are valuable and deserve higher rankings.
But there’s no one-size-fits-all benchmark for “good” engagement, as optimal levels vary based on content format, topic complexity, and search intent.
For example:
Blog posts tend to have higher bounce rates (50-90%) since they may satisfy informational queries quickly.
Product/service pages’ bounce rates would be around 40-80% and acceptable if users find what they need.
Pages with lead magnets like downloadable templates may see lower bounce rates of 30-70% from users consuming that gated content.
Rather than chasing universal standards, analyze engagement KPIs relative to your own historical norms and competitors. Identify outlier pages with unusually high/low engagement to diagnose potential content fit issues. If a new blog post spends significantly less time on page than similar topics, it may require optimization or promotion adjustments.
Ultimately, map engagement KPIs back to your goals for different content types. For blogs, sustained time on page could matter more than bounces if the intent is awareness/education rather than immediate conversion.
6. Revenue from search
KPI Category: Revenue
While key performance indicators like rankings, clicks, and conversions reveal operational SEO impact, tracking revenue from organic search shows the overarching financial value being generated.
The standard formula to calculate this metric is:
Revenue from Search=Total Conversions from Search×Average Revenue per Conversion
Or with proper attribution tools like HockeyStack or Dreamdata, you can see the exact revenue attributable to search and the total revenue it influenced.
Attribution is a huge headache for VPs and CMOs justifying budget allocation. Different models tell different stories:
First-touch gives 100% credit to the initial source and favors top-of-funnel channels like SEO.
Last-touch gives 100% credit to the final source and undervalues SEO’s lead nurturing role.
Linear divides credit equally to provide a balanced view.
The perceived value of SEO varies based on the model used. A multi-touch approach accounting for SEO’s full-funnel influence is the most accurate.
Advanced tools automate attribution and provide real-time ROI data for confident reporting and optimization.
As a purely financial metric, revenue from search is a lagging indicator that confirms your content and technical SEO strategies translate visibility into tangible bottom-line value. Segment this metric as much as possible to inform smart resource allocation across SEO initiatives by revealing the highest potential leverage points.
7. Customer Lifetime Value (CLV)
KPI Category: Revenue
Customer Lifetime Value (CLV) measures the total revenue a customer will generate over their entire relationship with a business. It reflects the long-term payoff from acquiring new customers through SEO and engaging them across channels.
While often viewed through a marketing/sales lens, CLV is a unifying metric that SEO teams should absolutely incorporate. SEO’s role in driving top-of-funnel traffic and influencing buying journeys means optimizing for long-term CLV rather than just short-term conversions.
Calculate SEO’s CLV impact by modeling organic traffic value based on conversion rates, purchase frequency, average order values, and customer tenures. Benchmark CLV from organic channels versus other acquisition sources. Prioritize SEO strategies that attract high-CLV audience segments.
Beyond marketing alignment, quantifying SEO’s CLV influence can guide product roadmaps, retention initiatives, and broader business strategy. A unified CLV philosophy ensures SEO’s search dominance efforts map to maximum customer lifetime value creation.
8. Google Business Profile data
KPI Category: Local SEO
Google Business Profile metrics offer a wealth of data on how users find and interact with your business online. These include:
Views: View counts show how many times users have seen your business profile on Google Search or Maps. This includes both direct and indirect views.
Searches: This metric tracks the number of times your business was shown in a search result, either through a direct search for your business or through categories, keywords, or attributes associated with your listing.
Calls: This metric tracks the number of times users click on the “Call” button on your business profile to make a phone call directly from their mobile device.
Direction Requests: This metric shows the number of times users clicked on the “Directions” button on your business profile to get directions to your location.
For example, increased direction requests or calls show improved local search visibility and interest in your business, directly resulting from enhanced profile optimization or local SEO efforts. Monitoring these metrics pinpoint the impact of your local SEO and Google Business Profile optimization efforts. It allows you to attribute increases in local engagement and inquiries to specific actions taken.
These metrics are directly linked to SEO KPIs by showing how improvements in local SEO contribute to higher visibility and engagement in local search results. Use these metrics to refine your strategies, target your local audience better, and ultimately drive more foot traffic and calls.
Evolution of SEO over the years
As both a demand generation and demand capture channel, SEO now aims to achieve the same goals as other marketing channels—driving quality leads, conversions, and revenue.
But SEO’s unique ability to influence the entire buyer journey enables tracking leading indicators earlier in the funnel. Monitoring visibility, authority, and engagement metrics provides advanced visibility into demand trends and content resonance. This intelligence optimizes SEO strategies before impacts manifest in downstream metrics like leads and sales.
As an always-on channel, SEO’s evolution centrally positions it to guide businesses in reading consumer behavior signals, mapping content to buyer journeys, and driving sustainable revenue growth through search.
Speed up your organic growth journey
Find out how we use content, strategy, and SEO to build your authority and drive your business forward.
FAQ
What are SEO KPIs?
SEO KPIs (Key Performance Indicators) are critical data that measure how effective your search engine optimization strategies are.
This data provides valuable insights into your website’s visibility, organic traffic, keyword rankings, user engagement, and conversion rates. Tracking SEO KPIs allows you to pinpoint areas for improvement and pivot your tactics based on quantifiable data.
Kiran Shahid
Kiran Shahid is a seasoned content strategist with over 9 years of experience crafting compelling content for industry-leading B2B SaaS brands like Semrush, Sprout Social, and HubSpot. Her expertise in SEO and content marketing helps her deliver results-driven strategies that drive growth and establish thought leadership for her clients. In her spare time, you can find her trying out foods or booking her next travel adventure.
To provide the best experiences, we use technologies like cookies to store and/or access device information. Consenting to these technologies will allow us to process data such as browsing behavior or unique IDs on this site. Not consenting or withdrawing consent, may adversely affect certain features and functions.
Functional
Always active
The technical storage or access is strictly necessary for the legitimate purpose of enabling the use of a specific service explicitly requested by the subscriber or user, or for the sole purpose of carrying out the transmission of a communication over an electronic communications network.
Preferences
The technical storage or access is necessary for the legitimate purpose of storing preferences that are not requested by the subscriber or user.
Statistics
The technical storage or access that is used exclusively for statistical purposes.The technical storage or access that is used exclusively for anonymous statistical purposes. Without a subpoena, voluntary compliance on the part of your Internet Service Provider, or additional records from a third party, information stored or retrieved for this purpose alone cannot usually be used to identify you.
Marketing
The technical storage or access is required to create user profiles to send advertising, or to track the user on a website or across several websites for similar marketing purposes.