SEO Forecast: How to Model Organic Growth With AI Search in the Picture
Build an SEO forecast that accounts for AI Overviews, AI Mode and AI referrals, with our CTR study, scenario method and free ROI calculator.
 Written by
Maeva Cifuentes
An SEO forecast is the number your CFO will hold you to, so it has to survive contact with AI Overviews, AI Mode, core updates and a sales team asking where the demos came from. I build forecasts for every Flying Cat client proposal and reforecast them at every quarterly review. This guide shows the method we use, the CTR data behind it, and the adjustments that keep a forecast credible now that a growing share of discovery happens inside AI answers.
The short version is simple. Forecast from your own Search Console and analytics history, discount clicks where AI features appear, model AI referrals as their own line, and tie every scenario to the work your team can ship. Then forecast demo requests and signups, because traffic alone stopped being a reliable proxy for pipeline in 2025.
What an SEO forecast is
An SEO forecast is a projection of organic search performance over a set period, usually 6 to 12 months, based on historical data, planned work and market conditions. A good one projects three layers. The first layer is visibility (impressions, rankings and presence in AI answers). The second is traffic (clicks from Google and visits from AI assistants). The third is business outcomes (demo requests, trial signups, pipeline and revenue).
The third layer is the one leadership funds. The first two are leading indicators that tell you early whether the third is on track.
A forecast is a planning tool with documented assumptions. It shows the relationship between the resources you put in and the range of results you can expect. When results drift, the assumptions tell you which input changed, so the conversation moves from "the forecast was wrong" to "we published five articles instead of eight, which cost us this much."
Why SEO forecasts miss in 2026
Classic forecasting assumed that a ranking position converted into a predictable share of clicks. AI features, core updates and analytics changes broke that assumption.
AI Overviews absorb clicks. Seer Interactive tracked 3,119 informational queries across 42 client organizations and found organic CTR on queries with an AI Overview fell to 0.61% by September 2025, against 1.62% on queries without one (Seer Interactive, September 2025 update). Ahrefs compared December 2023 with December 2025 across 300,000 keywords and found the top-ranking page earned 58% fewer clicks when an AI Overview appeared (Ahrefs, February 2026).
AI Mode adds a second Google surface. Google reported in May 2026 that AI Mode had passed 1 billion monthly active users and AI Overviews 2.5 billion (Google, May 19, 2026). AI Mode clicks and impressions count toward Search Console Performance totals under the Web search type, with no separate filter (Search Engine Journal, June 2025).
Core updates keep resetting baselines. Google ran a March 2026 core update from March 27 to April 8 and a May 2026 core update from May 21 to June 2 (Search Engine Roundtable). One of my enterprise clients had a forecast built on six months of stable performance, targeting 15% quarterly growth. Three weeks in, a core update hit their industry and rankings dropped across the board. The forecast was obsolete before the month ended.
Measurement leaks. AI assistants send visits that analytics tools misattribute. In October 2026, after ChatGPT rolled out a new interface, measured ChatGPT sessions fell by roughly half in one week across several of our B2B SaaS clients. Those visits now land in GA4 as Direct. ChatGPT still drove demo requests at the August and September pace, which is why we forecast demos and engaged sessions as the steadier signal.
None of this makes forecasting pointless. It makes single-number forecasts dangerous. SEO outcomes are probabilistic, so the forecast has to show ranges, name its assumptions and get revisited on a schedule.
The three core forecasting methods
I often combine these methods, since each answers a different question.
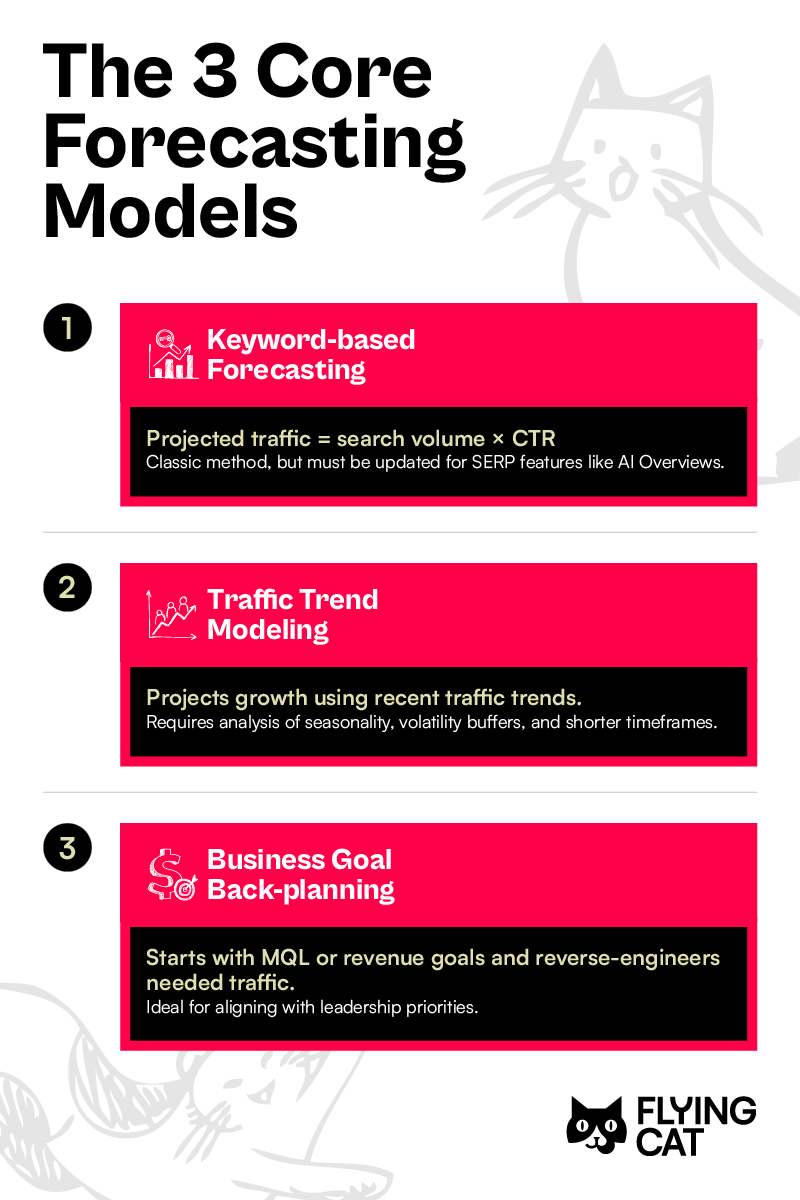
| Method | Question it answers | Best for | Main weakness |
|---|---|---|---|
| Keyword-based | What could we gain from ranking for these terms? | New content plans, new markets | Relies on tool volumes and CTR curves |
| Traffic trend modeling | Where is current performance heading? | Established sites with 12+ months of data | Assumes the past repeats |
| Business goal back-planning | What do we need to hit the pipeline target? | Budget and headcount conversations | Can produce targets the team cannot reach |
Keyword-based forecasting
This is the classic spreadsheet. List target keywords with search volume, current position, target position and an expected CTR.
Projected monthly clicks = search volume × expected CTR at the target position
The method has two known flaws. Keyword tools misjudge demand, especially for bottom-funnel terms. When we built Trevor.io's bottom-funnel program, keyword tools showed 10 or fewer searches for terms that later brought in far more traffic. Meanwhile "Looker vs Tableau" showed over 1,000 searches a month and brought 11 clicks. Trevor.io beat its traffic forecast by 402%. One alternatives page ranked for 426 keywords. Volume-based forecasts undercount long-tail variants and overcount head terms.
The second flaw is the CTR assumption. Generic curves that give position one 30% of clicks ignore AI features and intent. Segment your keywords by whether an AI Overview appears, then apply CTRs from your own Search Console data. If an AI Overview appears and your page is not cited in it, assume lower CTR.
Traffic trend modeling
Trend modeling projects future performance from historical patterns and seasonality. Excel's FORECAST.ETS function or the Google Sheets equivalent handles basic versions. Time series models like ARIMA or Prophet need some code, which an AI assistant can help you write.
Use the full history for seasonality, then weight recent months more heavily for the growth rate. For an AI tax research platform, our nine-month forecast anchors on 16 months of actual Search Console and GA4 history, with downside, base and upside scenarios. Keyword volume plays no part in it.
Dampen recent growth before you project it. If you have seen 8% month-over-month growth, a conservative forecast might use 5% to 6% for the next quarter, with the stated caveat that it assumes no major algorithm update.
Business goal back-planning
Back-planning starts from the outcome. Say the CMO needs 500 new MQLs a month from organic. At a 2% organic conversion rate, that requires 25,000 organic visits. With current traffic at 15,000, the shortfall is 10,000 monthly visits, which you then translate into pages, links and time.
The adaptation for 2026 is to stop assuming a flat conversion rate. Traffic quality now changes faster than traffic volume. For one SaaS client, we saw a 12% drop in organic traffic alongside a 22% increase in demo requests. The visitors who stopped clicking were researchers who got their answer from an AI Overview and would not have converted anyway.
Leapsome shows the same pattern at larger scale. SEO-sourced non-branded sales-accepted opportunities grew 47% while non-branded clicks fell 36%. A non-branded click became 2.3 times more likely to turn into an opportunity. A traffic-only forecast would have called that year a failure. Back-planning works best when you build it around traffic that AI cannot satisfy, such as comparisons, pricing questions and implementation detail.
What our 500-keyword CTR study found
In March 2025, I ran a CTR study across 500 randomly selected keywords to test whether AI Overviews were reducing clicks. The results ran against the early industry studies.
- Position one earned a 57.33% CTR across the sample, far above the 20% to 30% that older benchmark curves assign.
- Position one with an AI Overview earned a 46.88% CTR, against 35.17% without one.
- Positions 9 and 10 saw up to 281% higher CTR when an AI Overview was present, a bottom-of-page surge I had not expected.
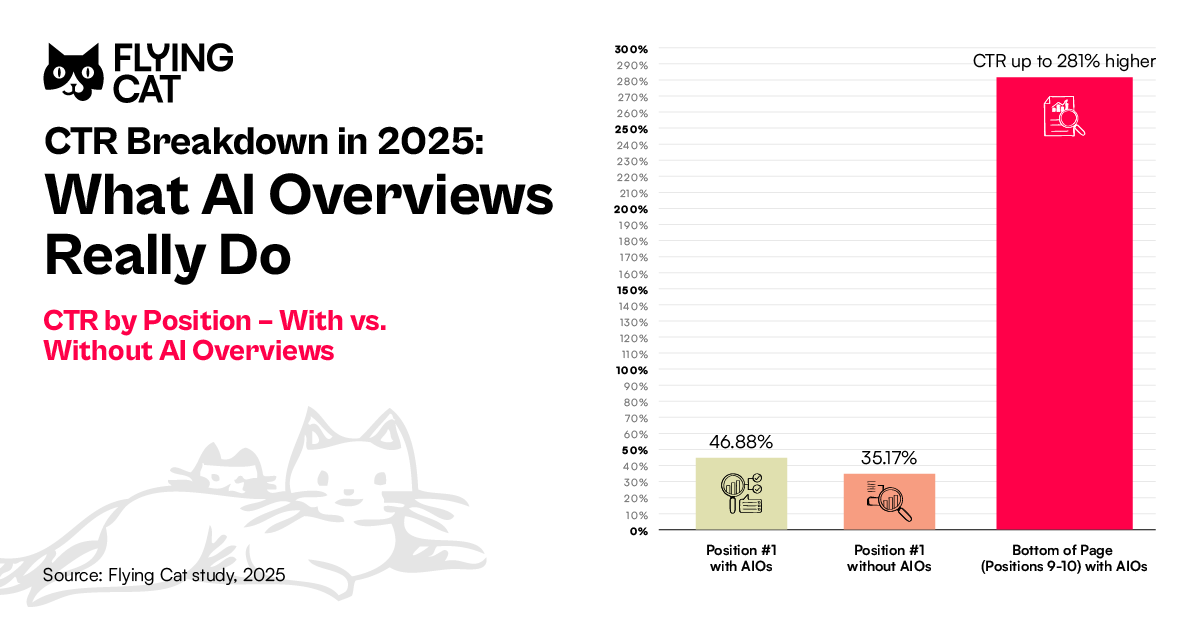
The caveat is sample composition. AI Overviews appeared on 10.58% of the keywords in my March 2025 sample, so the with-AI-Overview figures rest on a small subset. Prevalence has grown since then. Pew Research found an AI summary on about 18% of the Google searches its US panel ran in March 2025 (Pew Research Center, July 2025). Ahrefs found AI Overviews on 20.5% of 146 million desktop results pages in September 2025 (Ahrefs, November 2025). Conductor measured 25.11% of US searches in September and October 2025 (Conductor 2026 AEO/GEO Benchmarks).
The larger 2025 and 2026 studies point the other way on CTR. Pew found users clicked a standard result on 8% of visits to pages with an AI summary, against 15% without one. Seer and Ahrefs, cited above, both measured steep declines. My read is that my sample captured a specific moment, when AI Overviews appeared on fewer queries and users still clicked through to verify them. For a forecast today, treat my figures as an upper bound and your own Search Console data as the source of truth.
Intent shapes exposure more than anything else. In the Ahrefs September 2025 data, 21.4% of informational results pages showed an AI Overview, against 4.3% of commercial and 2.1% of transactional pages. A B2B SaaS forecast weighted toward comparison and pricing keywords carries far less AI Overview risk than one built on definitions and how-to queries.
How to forecast SEO with AI search in the picture
AI search changes several inputs in the forecast. Model each one explicitly so leadership can see what you assumed.
Discount CTR where AI Overviews show
Tag every target keyword by whether an AI Overview appears and whether your domain is cited in it. Then apply different CTR assumptions to each group.
| Keyword group | CTR assumption |
|---|---|
| No AI Overview | Your own Search Console CTR by position |
| AI Overview, your page cited | Your own CTR, discounted modestly |
| AI Overview, your page not cited | Your own CTR, discounted heavily (Seer measured cited pages at 0.70% CTR against 0.52% for pages not cited, Q3 2025) |
| Branded | Your branded CTR, which stays high |
Seer's data puts organic CTR on queries with an AI Overview at roughly 38% of the no-AI-Overview level by September 2025 (0.61% against 1.62%). Ahrefs measured position-one clicks 58% lower. A discount of 40% to 60% on uncited informational keywords is a defensible starting range. Replace it with your own numbers once you have a quarter of data. Since August 31, 2026, Search Console's generative AI performance report shows impressions in AI Overviews and AI Mode for every site with enough data (Google Search Console Help). The report has no clicks, so pair it with page-level clicks from the standard Performance report to estimate CTR on AI-exposed pages.
Account for AI Mode
AI Mode data sits inside your Search Console totals, blended with classic results. You cannot forecast it as a separate click line from Google's data alone. Practical adjustments help. First, expect impressions to rise faster than clicks on informational pages, because AI Mode shows links that users click less often. Second, use the generative AI report's impressions trend as the visibility input for AI Mode and AI Overviews together. Forecast clicks from the blended Web total.
Forecast AI referral traffic and conversions separately
Visits from ChatGPT, Perplexity, Gemini, Copilot and Claude arrive as referrals, outside Search Console. Give them their own forecast line. Conductor measured AI referrals at 1.08% of all website traffic across 1,215 enterprise domains from May to September 2025, rising to 2.80% in information technology, the highest of ten industries (Conductor).
The share is small, so the forecast case rests on conversion rate. For an AI tax research platform, ChatGPT referral sessions grew 5.8 times in Q3 2026 against Q3 2025. Visitors from chatgpt.com converted to free trial at 3.3%, against 2.0% for Google. At Leapsome, AI assistant visits converted to demo requests at more than twice the rate in Q3 2025. The enterprise procurement platform in our GEO case study raised its conversion rate on ChatGPT visits 2.6 times year over year.
Model AI referrals with their own conversion rate, then add a correction for leakage into Direct. After the October 2026 ChatGPT interface change described above, referral sessions alone understate AI's contribution. Track AI-attributed demo requests and add a "Where did you hear about us?" field to demo and signup forms. The AI customer service platform we work with added that question to its web form and began reporting on it in October 2026.
Use AI visibility as a leading indicator
Traffic from AI answers lags visibility in AI answers. Forecast visibility first, measured as the share of answers that mention your brand across an agreed prompt set. We run each prompt about 75 to 80 times a month across eight AI assistants, because a single answer is noise. AI ranking position is unreliable, so we report visibility percentage across many prompts instead.
D2L went from appearing in 12% to 33% of tracked AI answers between December 2025 and September 2026. Over the same period, demo requests from organic search and LLMs grew 73%. Demo requests from ChatGPT grew 3.2 times year over year. The enterprise procurement platform's reports led with demo requests from AI and search, with visibility as the leading indicator. That pairing is the forecast structure I recommend. Visibility targets give you an early read within the first 60 days. Demo targets carry the business case. Our AEO measurement guide covers how to set up the prompt set.
Step by step: build your SEO forecast
The method below is the one behind our client proposals. It produces a 12-month forecast with three scenarios, tied to capacity and to business outcomes.
Step 1: Gather your baseline data
Pull these from Search Console, GA4 and your CRM.
- Monthly organic clicks and impressions for the past 16 months, for seasonality
- The most recent 3 to 4 months as the growth-rate baseline, since it reflects current SERP layouts
- Query-level data with position, impressions and clicks
- Organic and AI referral conversion rates by page type
- Pipeline and closed revenue sourced or influenced by organic, from your CRM
- Content output per month and the average clicks a new page earns after six months
Step 2: Segment keywords by intent and AI exposure
Classify target keywords into groups that behave differently.
- Informational, AI Overview present: highest click risk
- Commercial and transactional: comparison, alternatives, pricing and demo-intent terms, with lower AI Overview exposure
- Branded: stable CTR, driven by demand outside SEO
- Long-tail specifics: detailed queries that AI summaries answer less fully
Forecast each group separately. A blended model hides the fact that your commercial pages and your glossary pages are on different trajectories.
Step 3: Build your own CTR curve
Export 3 to 6 months of query data from Search Console. Group queries by position and calculate average CTR for each position. Then split the curve by segment.
- Branded and non-branded
- Informational and commercial
- Queries with and without an AI Overview
Your position-one CTR for commercial queries might be several times your position-one CTR for informational queries. Use the matching figure for each keyword group. Refresh the curve every quarter, because SERP layouts keep changing.
Step 4: Define your growth levers and timeline
List the work that will drive growth and when each lever shows impact.
- New content: pages typically take 3 to 6 months to reach full traffic
- Content refreshes: often faster, since the page already has history
- Technical fixes: can show impact within 1 to 2 months
- Links and third-party placements: compound over 3 to 9 months
- AI visibility work: movement within about 60 days, conversions after
Technical fixes can carry a forecast on their own. Softr's paid signups rose 125% in the first two months from technical fixes alone, before any new pages were published.

Estimate each lever's impact from your own history. If new posts average 200 visits a month after six months, ten new posts add about 2,000 monthly visits once they mature. Lay the ramp out month by month instead of adding the full impact at once.
Step 5: Build capacity-based scenarios
Forecasts built on keyword opportunity alone assume unlimited execution. Start instead with what the team can ship. Document monthly content output, developer hours for SEO tickets and link or placement volume. Then build three scenarios tied to resource levels.
| Scenario | Confidence | Example inputs | Example output |
|---|---|---|---|
| Conservative | About 70% | 2 articles a month at 150 visits each, one core update hit | 300 new visits a month |
| Expected | About 50% | 4 articles a month at 200 visits each, current SERP mix | 800 new visits a month |
| Ambitious | About 30% | 6 articles a month at 250 visits each, added budget | 1,500 new visits a month |
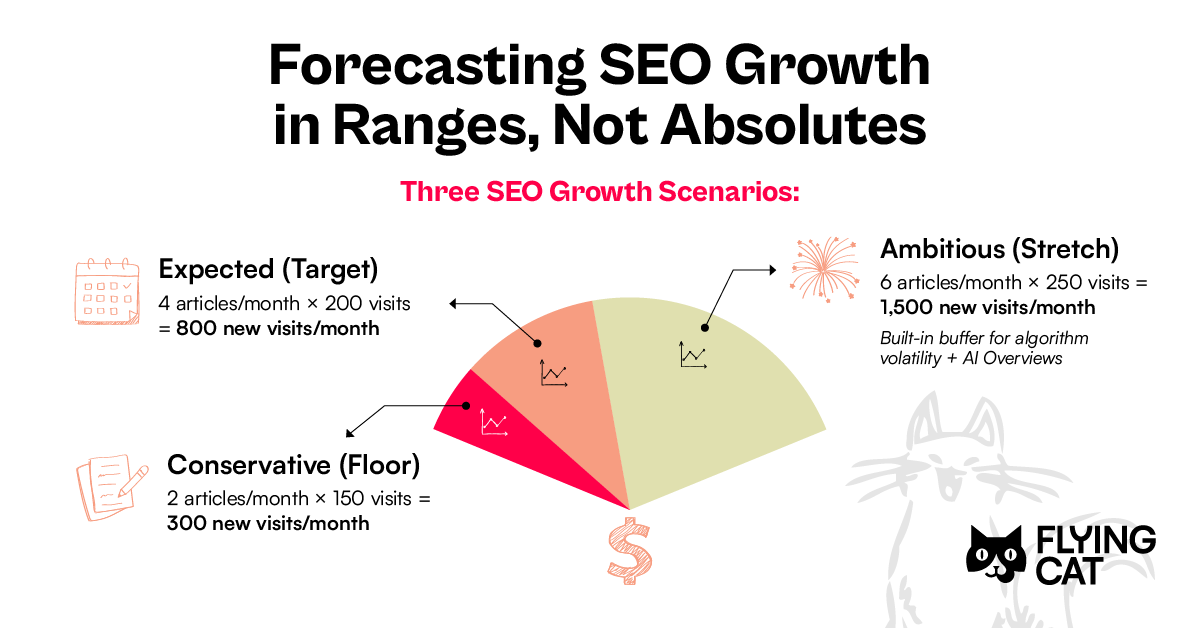
Capacity-based scenarios change the leadership conversation. If the ambitious goal needs 15 articles a month and the team ships 5, the options are explicit. Leadership can scale the goal back, add resources, extend the timeline or prioritize the highest-intent pages first. The forecast becomes a resourcing decision instead of a promise.
The same logic applies to budget split. In 2026 we often move part of a content budget into placements on the third-party pages AI assistants cite, which shifts output from page count toward visibility. Your scenarios should show that trade so the forecast matches the plan.
Step 6: Convert traffic into business outcomes
Apply conversion rates by page type and source, never one flat rate. At the enterprise procurement platform, one decision-stage page converted at 17%, against 0.24% for high-traffic educational pages. A blended rate would have sent the content budget to the wrong pages.
Build the chain from clicks to revenue.
- Clicks and AI referral visits by page group
- Conversions by page group (demo requests, trial signups)
- Qualified opportunities, using your sales team's own definition
- Pipeline value and closed revenue, using your close rate and average deal size
- Customer acquisition cost from organic, compared with paid channels
Our client KPIs follow this chain. The two primary KPIs are the visitor-to-demo or trial conversion rate and the SQL-to-opportunity rate. Position, CTR and engagement are secondary leading indicators. If you need help with attribution setup, our digital analytics service covers it.
Step 7: Add a volatility buffer and a reforecast schedule
Build volatility into the model. Look at how past core updates moved your traffic. Then apply a buffer of 10% to 15% to the conservative scenario. Then set the rules for revisiting the forecast.
- Monthly: compare actuals with the expected scenario, month over month
- Quarterly: reforecast the next two quarters and compare year over year
- Trigger-based: reforecast immediately if organic clicks drop more than 15% week over week or a core update lands
Keep an assumptions log with dates. When results deviate, check which assumption moved. If the expected scenario assumed eight articles a month and the team shipped five, you can quantify the shortfall instead of declaring the forecast wrong. Every Flying Cat quarterly review includes performance against goal, an updated goal and the next two months of planned work, which is where this reforecast happens.
Use our SEO ROI calculator
For a fast first pass, use our calculator. It turns monthly organic clicks, conversion rate, lead-to-close rate, customer lifetime value and monthly SEO investment into a month-by-month projection with breakeven and return.
Use our SEO ROI calculator (ungated). We built it on the forecasting model we use for Flying Cat client proposals.
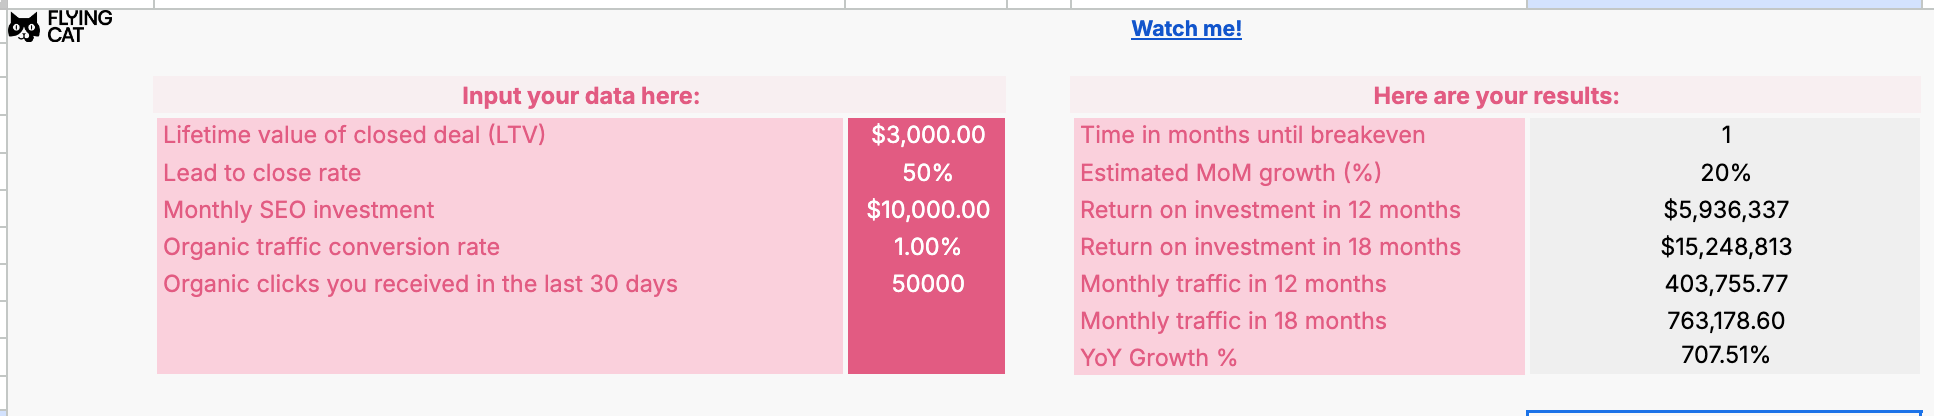
To use it.
- Enter your current monthly organic clicks and organic conversion rate.
- Add your lead-to-close rate and customer lifetime value.
- Enter your planned monthly SEO investment.
- Compare the projection at two or three investment levels.
The screenshot uses sample inputs. Your results depend on your conversion rates and deal values, so run it with your own numbers before you show anyone. We kept the calculator simple on purpose, because complex tools create false precision. Treat it as the starting point for the keyword-level and scenario work above. Pair it with the AI referral line from the previous section, which the calculator does not model separately.
How to present your forecast to get buy-in
The forecast earns budget only if leadership trusts it.
Lead with business outcomes. Open with projected demo requests, pipeline and cost per acquisition compared with paid channels. Put traffic in the appendix. "We project 120 additional demo requests over 12 months at a cost per acquisition 40% below paid search" lands harder than "we project 25% more traffic."
Show the range. Present the three scenarios as a fan chart that widens over time. Say which conditions push results toward each edge. Name the scenario you are managing toward.
Name the risks up front. List the assumptions, the external risks (core updates, AI Overview expansion, analytics leakage) and the internal dependencies (writers, developer time, legal review). Name the leading indicators you will watch, such as AI visibility percentage, impressions on target pages and engaged sessions. Stakeholders who saw the risks in advance treat a miss as a shared problem.
Make every number reproducible. For one client, we only report a metric if the client can reproduce it in their CRM in two minutes, with the field name and filter written next to it. We also include a standing "what didn't work, what we're changing" section in each report. Both habits build more trust than an optimistic projection.
Analogies help non-SEO stakeholders. SEO behaves like an investment portfolio, with compounding returns and market swings you do not control. It also behaves like weather forecasting, where the general pattern is clear and specific outcomes get less certain further out. For the full investment case, see our guide to the business case for SEO and the business case for AEO.
How we build forecasts for Flying Cat clients
Every proposal we send includes a forecast built on the steps above. I lead the strategy on every account, so the person who builds the forecast is the person accountable for it at each quarterly review. For established sites, we anchor on actual Search Console and GA4 history. For new content programs and new markets, we combine keyword-based forecasting with capacity scenarios and our own conversion benchmarks by page type. Every forecast now includes an AI visibility baseline and an AI referral line next to Google.
If you want a forecast tied to your pipeline, our SEO strategy service and GEO and AEO service both start with one. Book a call to tell us your goals. We will show you what we would do about them.
SEO forecast FAQ
How do you forecast SEO traffic?
Start from 16 months of Search Console history for seasonality and the last 3 to 4 months for the growth rate. Add projected gains from new and refreshed pages using your own CTR curve by position, intent and AI Overview presence. Then layer three capacity-based scenarios on top and convert clicks into conversions with page-specific rates.
How accurate are SEO forecasts?
A forecast is a range with documented assumptions, so judge it by whether actuals land inside the range and whether you can explain each deviation. Expect wider ranges further out. Reforecast after every core update or any drop above 15% week over week.
How long does it take to see results from SEO?
Technical fixes can show impact within 1 to 2 months. New pages typically take 3 to 6 months to reach full traffic. AI visibility often moves within about 60 days. Conversions from that visibility follow later.
Can you forecast traffic from AI search?
You can forecast it as a separate line. Start with AI visibility across a fixed prompt set as the leading indicator. Then forecast AI referral sessions and their conversion rate. Add a correction for AI visits that land in Direct. Confirm the picture with a "Where did you hear about us?" field on your forms.
Founder and CEO of Flying Cat. She leads SEO and AI search strategy for B2B SaaS companies including D2L, Klaviyo, CoVet and Blue J.