Your internal site search data is a valuable source of content ideas. But what if we took it a step further? In this article, I’ll show you how to combine your site search data with your organic search ranking data from Google to identify potential content gaps: terms that your users are searching for on your site but you aren’t appearing for in Google search results pages.
We’ll do this in Looker Studio by blending data from two sources: Google Analytics 4 and Google Search Console. All these tools are free to use.
What is site search and why is this data valuable?
Site search is when users who are already on your site use your search functionality to find content on a particular topic. That’s different to organic or paid search, which takes place on a search engine such as Google and sends users to your site.
Not all sites offer site search: for example, if you have a single-page marketing site, site search wouldn’t be helpful to your users. But if your site contains a blog or an article section, then site search is a great way to let users find very specific content. Flying Cat puts its site search prominently at the top of its blog:
Not all sites offer site search: for example, if you have a single-page marketing site, site search wouldn’t be helpful to your users. But if your site contains a blog or an article section, then site search is a great way to let users find very specific content. Flying Cat puts its site search prominently at the top of its blog:

As well as benefiting your users, site search benefits you, the site owner: it gives you insight on the kind of content your users expect to find on your site. And if that content doesn’t already exist, you could create it. In short, site search data is a powerful way of generating relevant ideas for future content.
Site search data is generally more valuable on higher-traffic sites. If your site has low traffic, you’re unlikely to have many site searches—so it can be difficult to spot trends in the data.
So, to take advantage of site search data and follow along with this guide, you’ll need three things:
- Site search functionality on your site
- Enough searches for the data to be useful
- Tracking in place to see what your users are searching for
I can’t help with the first two points, but I can help with the third. Let’s look at how to configure site search tracking in Google Analytics 4 (GA4). I’m going to assume you already have a GA4 property set up and tracking your site, but if not, Google has a solid guide.
How to configure site search in GA4
The first step is finding out what your site’s “search term query parameter” is. This is a small value that appears in the URL (the web address shown in the browser title bar) after a user has carried out a site search. For example, if I go to the BBC website and search for my home city of “London”, the URL of the search results page is:
https://www.bbc.co.uk/search?q=london&d=SEARCH_PS
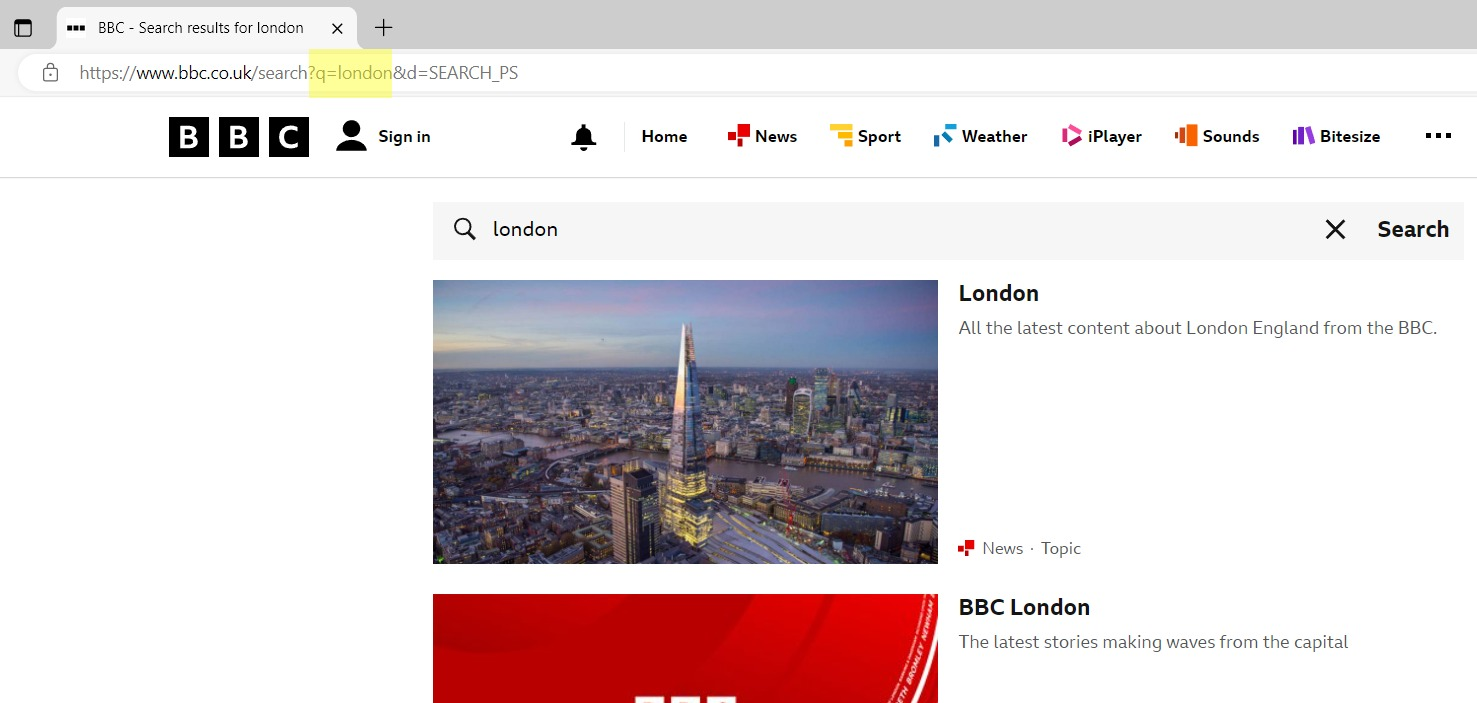
The relevant part here is “q=london”. This means the search term query parameter for this site is “q”. Generally, sites will use something like q, s, query or search.
Now we have that, we can move on to configuring site search. Fortunately for us, Google Analytics 4 has a feature called “enhanced measurement” which makes it easy to track interactions such as form submissions, link clicks, and… site search.
It isn’t the one way to track site search, but it is the simplest—you can complete the entire setup in GA4 without needing other tools such as Google Tag Manager (GTM).
When you originally set up your GA4 property, you may or may not have enabled enhanced measurement. (The default is “on” but I’ve worked with plenty of clients who had it set to “off” for one reason or another.) And, even if it is enabled, it may be that the site search tracking isn’t enabled or configured properly.
Here’s how to check both:
- In your GA4 property, go to Admin > Data Streams
- Click on your web data stream
- Under “Events”, toggle “Enhanced measurement” on

- Click on the cog icon to “configure enhanced measurement”
- Toggle “site search” on
- Click Show advanced settings
- Make sure the “search term query parameter box” includes the value you found out earlier
- Hit Save
But what if your site doesn’t show a search term query parameter at all? In that case, you won’t be able to use enhanced measurement to track site search and you’ll need a more advanced technique.
How to view your site search data in GA4
Now that you’ve completed the setup, every search on your site will generate an analytics event called “view_search_results”. You’ll see this coming through in GA4’s Realtime Overview, in the “Event count by Event name” card:
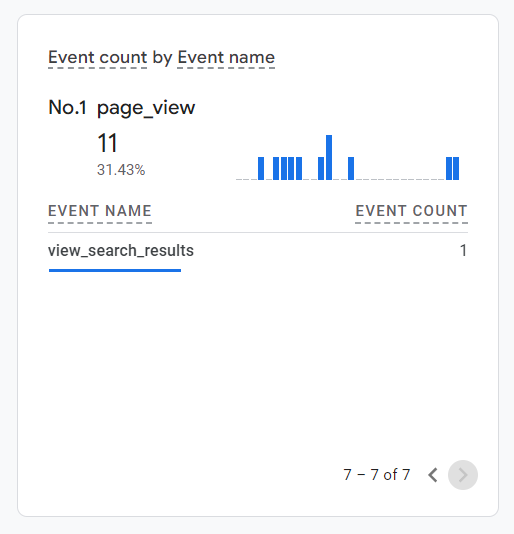
Click on the event to see its parameters (additional pieces of information about the event). There will always be a “search_term” parameter: this is the phrase that the user searched for and that GA4 picked up from the search page URL. You can click on this parameter to see all the searches that your users have carried out in the past 30 minutes.
After a day or two, your new event will be available to use in GA4’s regular reporting too. The two options are customizing a pre-built report or building an exploration from scratch: I prefer explorations as I feel they give me more control and are less cluttered.
Here’s a simple exploration looking at site searches on the Google Merch Shop (one of Google’s demo accounts):
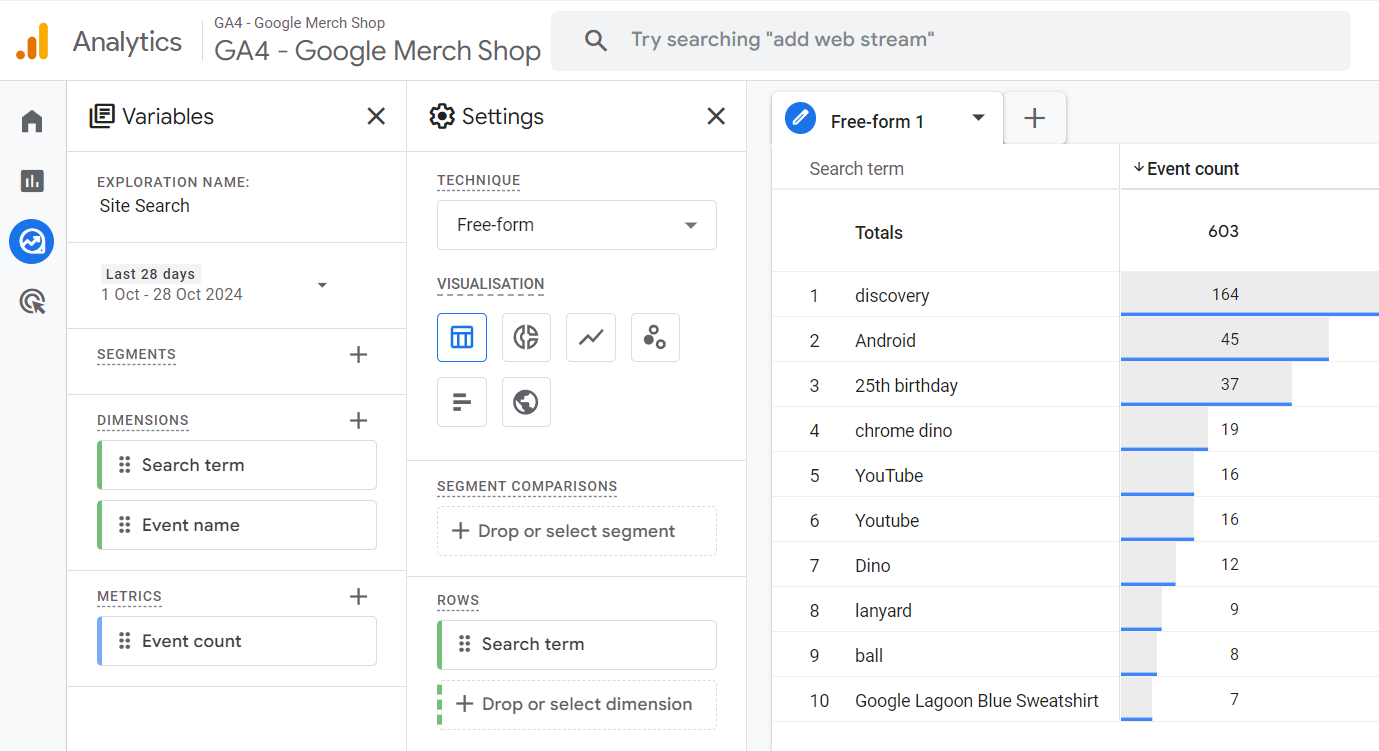
As you can see, I’ve added the dimension “Search term” and the metric “Event count”. This shows me how many times each search term has been searched for.
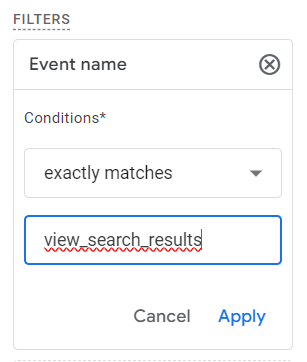
I’ve also added a filter based on the dimension “Event name”, so that “Event name exactly matches view search results”. This prevents a blank row appearing in the results counting all the events that didn’t have a site search at all:
Limitations of analyzing site search data directly in GA4
Whether you use reports or explorations, there are two big limitations with GA4 site search data that can’t be fixed in GA4 itself.
First, the data is case-sensitive. By that I mean that “Mexico”, “mexico” and “MEXICO” will show up as three separate search terms. Perhaps “Mexico” has 100 searches, “mexico” has 70 and “MEXICO” has 60. With the search volumes spread like this, you can’t see at a glance that Mexico is a popular search term with 230 searches. The risk here is that you will underestimate your users’ interest in this topic.
You can see this problem in my earlier example exploration, where the fifth and sixth most popular searches on the Google Merch Shop are “YouTube” and “Youtube”. If you were to combine the volumes, the term would be fourth instead.
Second, the data contains stray characters. In my experience, searchers often accidentally add a space either at the start or end of their search term. This again can mislead you, because “Mexico” will be listed separately to “Mexico “.
One option is to fix these issues at source—your website. If your site always rendered your search term query parameter in lower-case, then GA4 would only ever pick up lower-case search terms and all your data would be consistent. But, even if you have development resource to do this, it’s unlikely to be a commercial priority.
Another, lower-tech option would be to manually tidy up your data outside of GA4. In your exploration, click Export data to export your data to a CSV or Google Sheets:
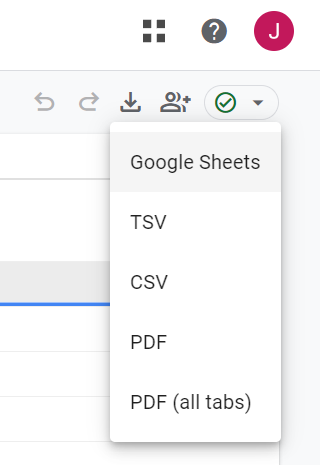
There, you can knock all the search terms to lower case, search and remove and stray spaces, then consolidate the data.
That’s OK for a one-off job, but not the best solution if you want to analyze your site search data regularly (as you should). Let’s look at a different approach.
Cleaning your site search data in Looker Studio
Looker Studio (formerly Google Data Studio) is a free data visualization tool from Google. It lets you work with data from Google tools such as Google Analytics, as well as other sources. And you can use Looker Studio to address those limitations in GA4’s site search data.
First, you’ll need to create a Looker Studio report and connect your GA4 property as the data source:
- Sign in to Looker Studio
- Use the button in the top left to Create a Report
- In the “Add data to Report” panel that appears, click on Google Analytics
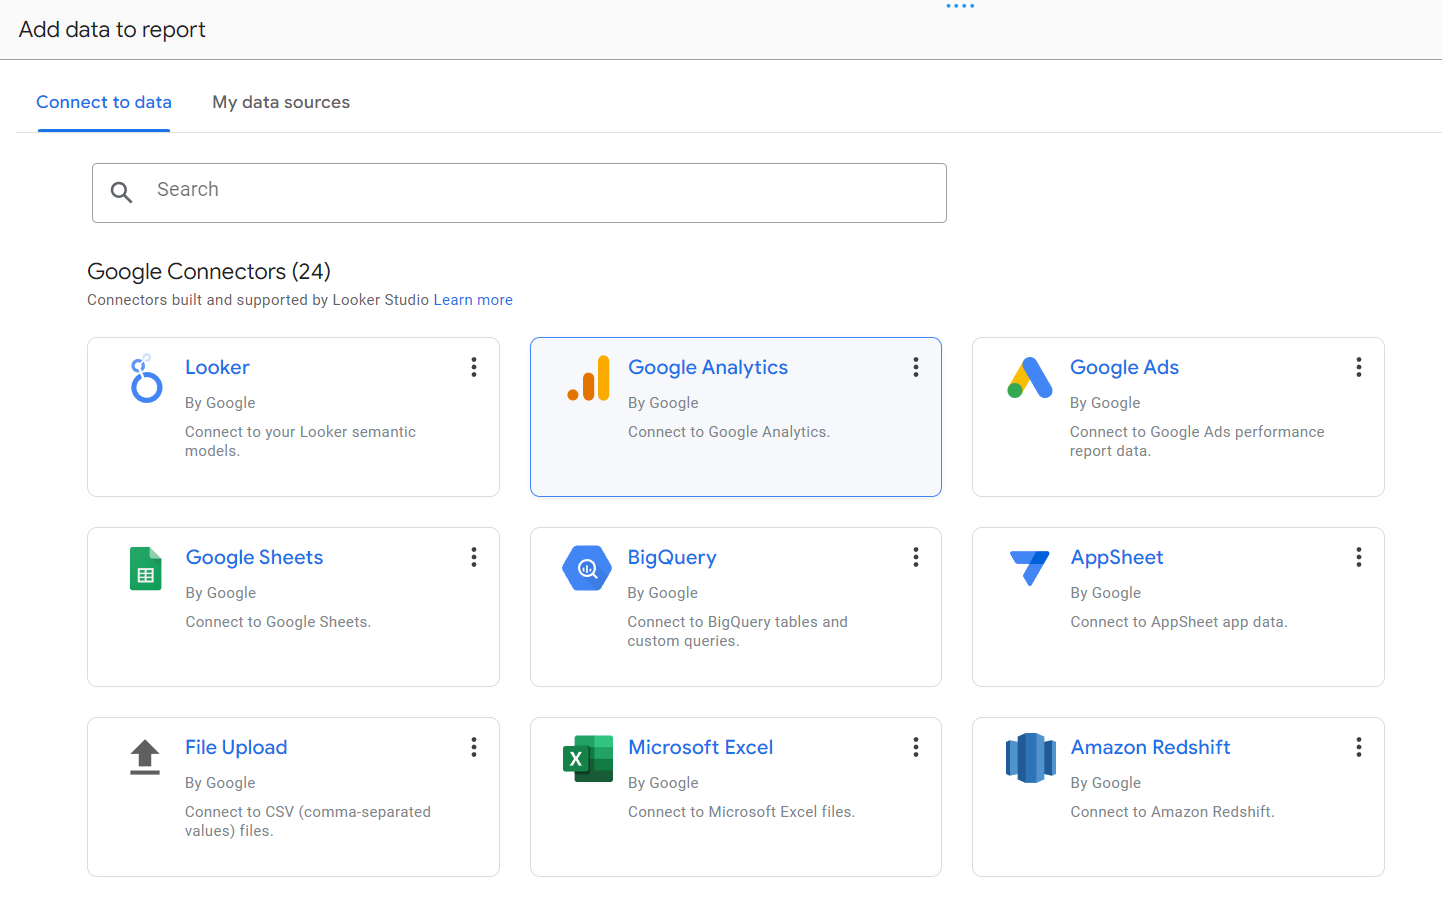
- Select your GA4 account and property from the dropdown list
- Click the blue Add button
- Click ADD TO REPORT
The next step is adding a table of your site search data to the report:
- In the main menu, select Insert > Table
- Click on the report canvas to add the table to it
- In the chart setup panel on the right, choose the dimension “Search term”
- In the same panel, choose the metric “Event count”
- Still in the chart setup panel, click on ADD FILTER and add a filter to exclude the row with the blank search term. Configure your filter like this:
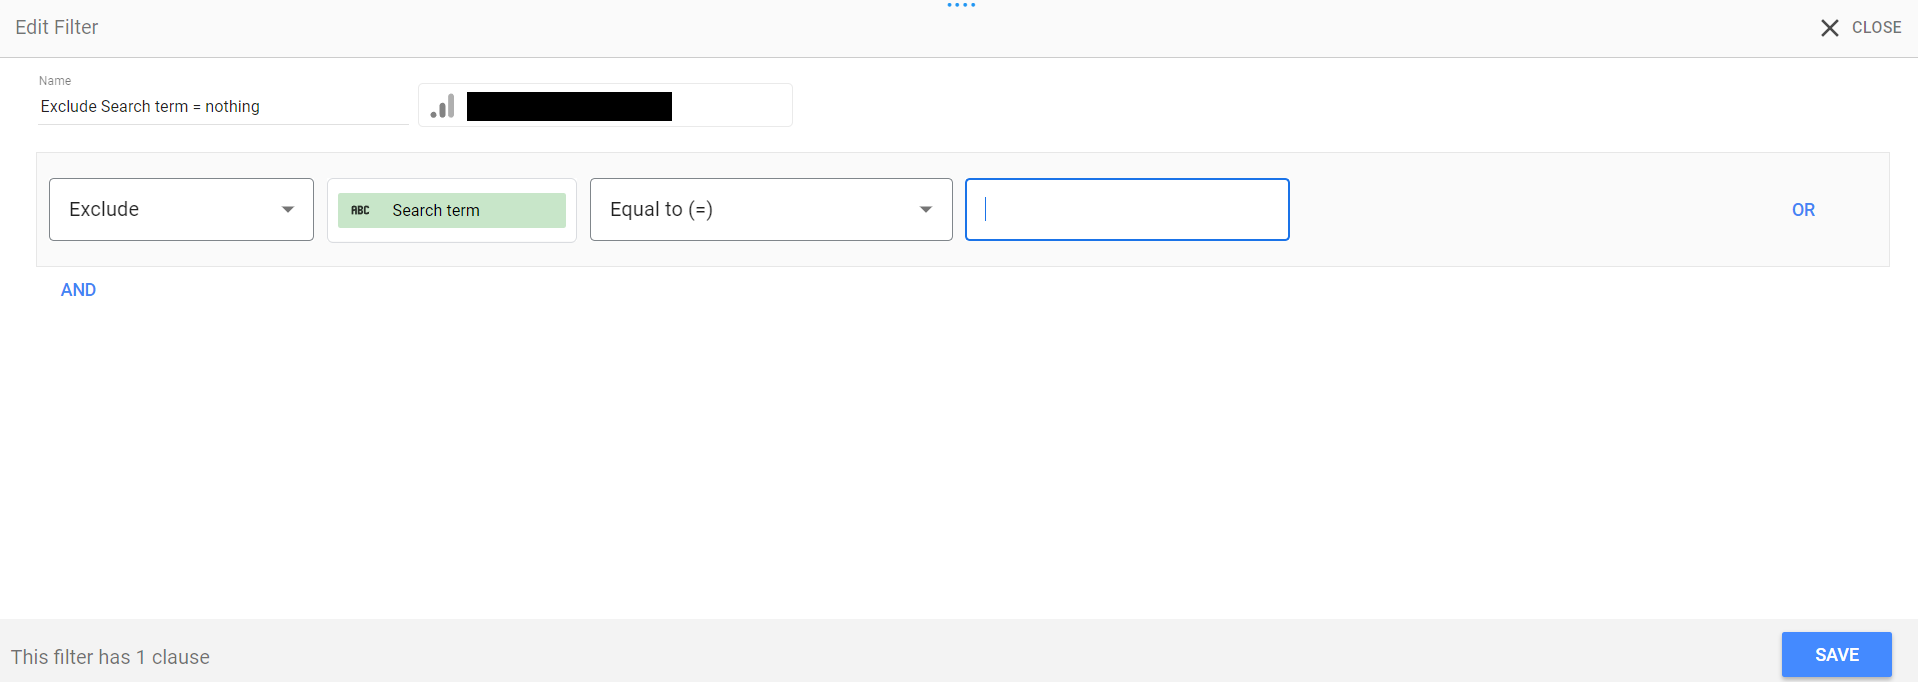
The table is now very similar to the GA4 Exploration we built earlier. But Looker Studio lets you go a step further. Let’s take the Search term dimension and combine a couple of functions to create a new, clean-up field:
- LOWER() will convert all the text to lower case
- TRIM() will remove any leading or trailing spaces
Here’s how:
- Back in the chart setup panel, click X to remove the Search term dimension we added
- Click Add dimension then ADD CALCULATED FIELD
- Give your new field a name, for example “Search term (Cleaned)”
- In the formula box, paste in: TRIM(LOWER(Search term))
- A green tick should appear at the bottom of the New field box to show that your formula is valid. Click Apply
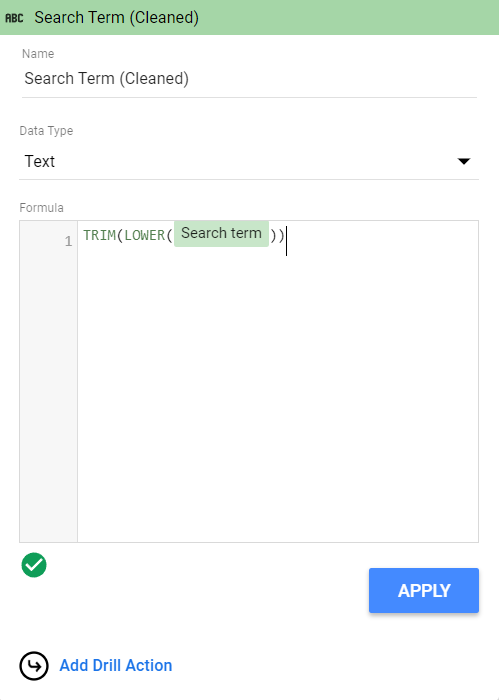
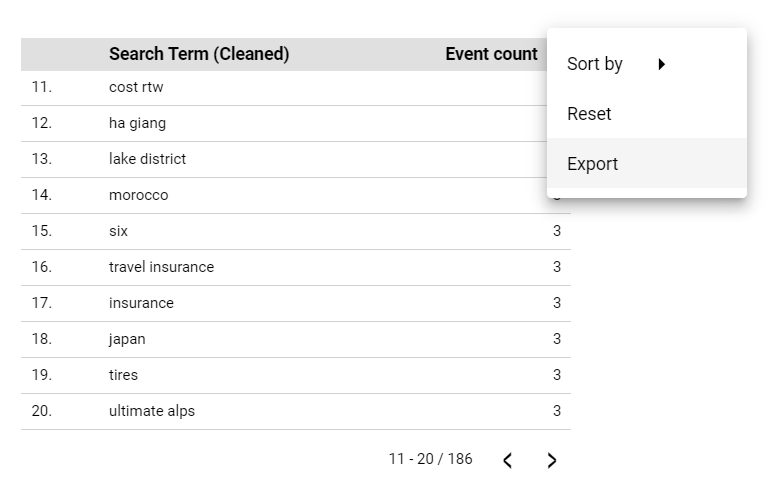
Your site search data is now cleaned! Terms such as “Mexico”, “mexico” and “mexico “ will all be combined into one.
If you want to export your cleaned data:
- Click View in the top right to switch from Looker Studio’s edit mode to view mode
- Hover over the table with your site search data in
- Click on the More icon (three dots)
- Click Export
Introducing Google Search Console as the second data source
Your site search terms are a rich source of content ideas. But for some of the terms, you’ll already have content that is ranking well on Google. They don’t represent content gaps, and writing more content for those terms could even lead to keyword cannibalization.
So we need a way to work out which of our site search terms we aren’t yet ranking for. To do this, we’ll use a second source of data, Google Search Console.
Google Search Console is another free tool from Google, one that helps you understand how Google sees your site and how your content is performing in organic search. To use Search Console, you’ll first need to verify your site (to prove that you own it).
Then you can bring your organic search data into your Looker Studio report:
- Have your Looker Studio report open in Edit mode
- In the menu, go to Resource > Manage added data sources
- Click ADD A DATA SOURCE
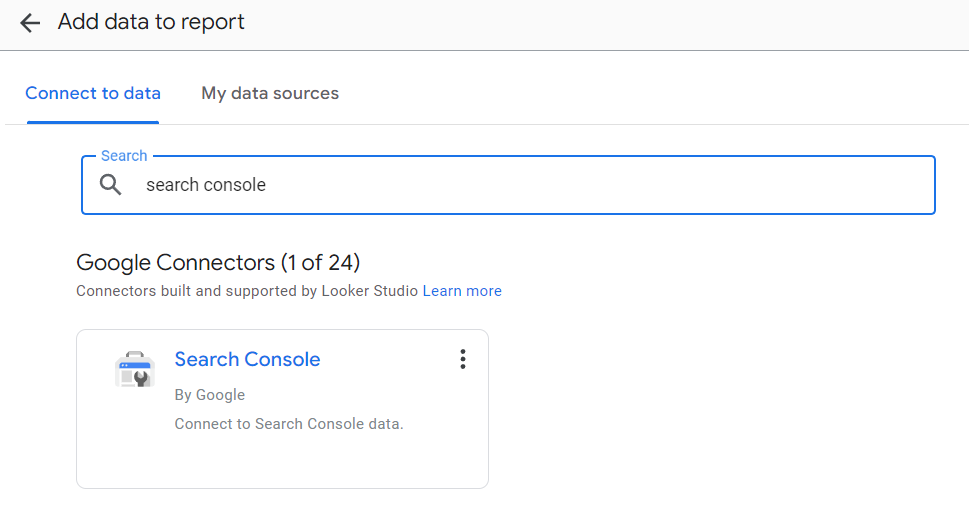
- Click Search Console—use the search box if you can’t see it:
- Select your site and choose the Site Impression table
- Choose the search type web
- Click Add
- Click Add to Report
Now insert another table into your report (Insert > Table). This time, in the setup panel, make sure Search Console is your chosen data source. Add the dimension “Query” and the metric “Average position”:
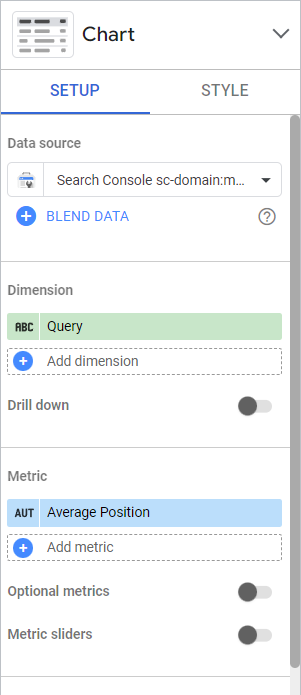
This table will show you which search queries you are ranking for in Google’s web search, and your average position (with 1 being the top position).
If you’ve followed along so far, your report will have two tables: one with your GA4 site search data, and one with your Search Console average position data. All that remains is to blend the two!
How to blend site search and GSC data in Looker Studio
Blending data in Looker Studio can be quite fiddly. I prefer to start with two tables that have the relevant dimensions and metrics already added. That way I can be confident my blended data source will contain just what I need. That’s why we built our GA4 and Search Console tables first.
- Hold down the “shift” key on your keyboard
- Click on your GA4 table followed by your Search Console table—the order is important here
- Release the “shift” key and right click on either of the selected tables
- Select Blend data from the contextual menu
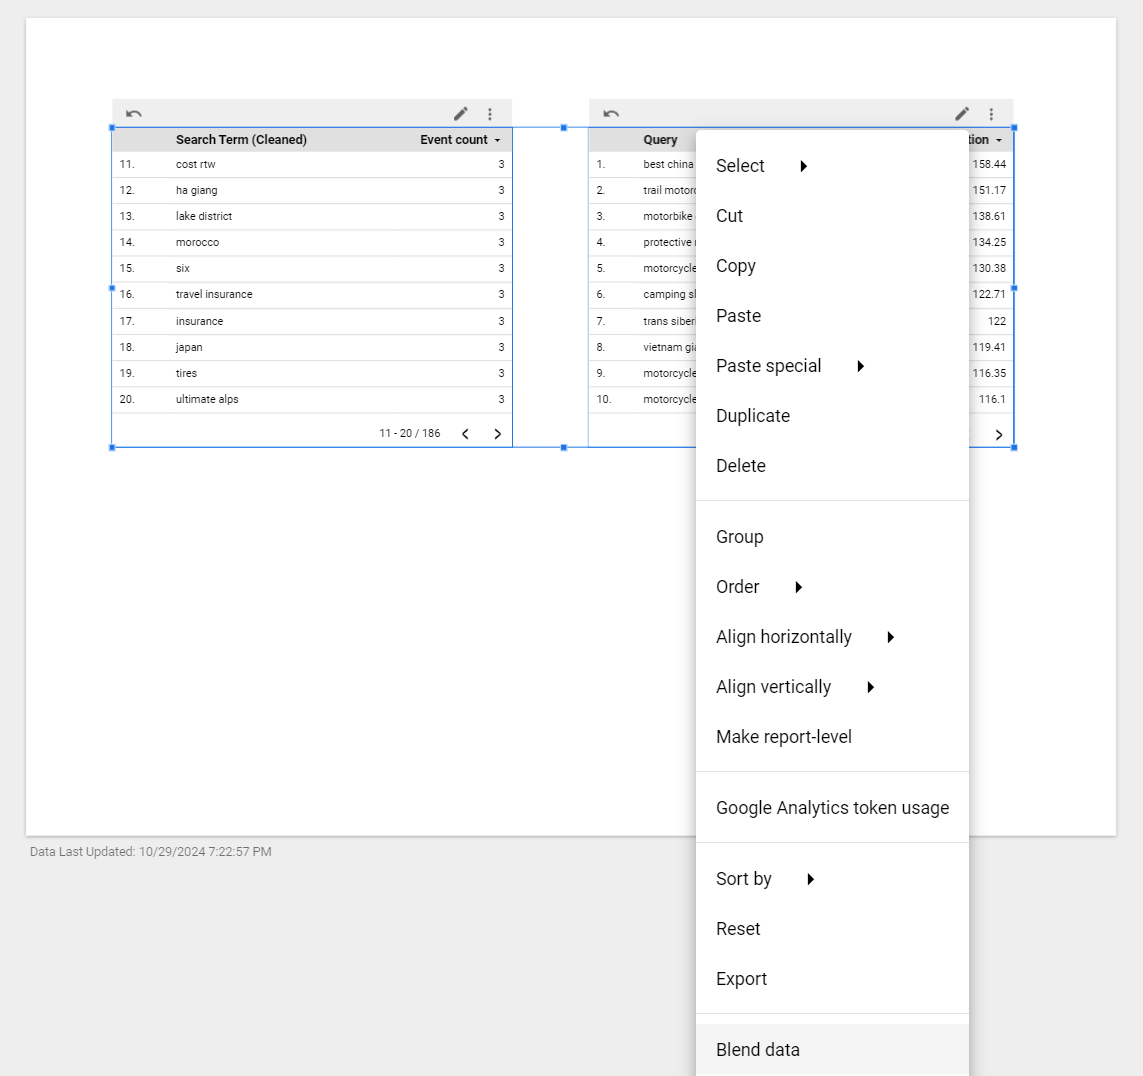
A new table will appear on your report, containing data from your existing two tables. We’re not done yet though, as some of the options for this newly merged data source need to be tweaked.
- In the main menu, go to Resource > Manage blends
- Find your “Blended data” and click Edit
- In the Edit window, click on Cross Join and change it to Left outer
- Under Join conditions, Add field “Search term (Cleaned)” on the left and “Query” on the right, so they are on the same row. Like this:
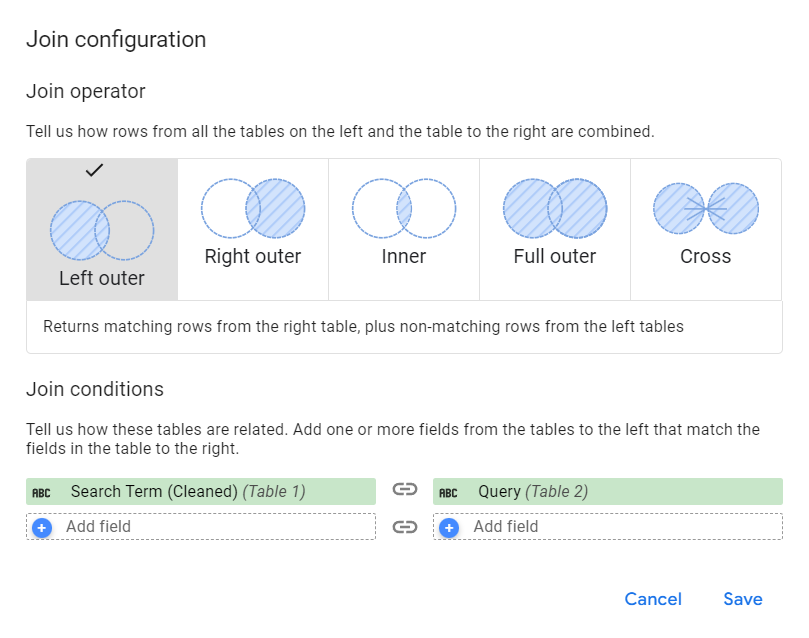
- Click Save in the “Join Configuration” panel—this will close
- Click SAVE in the edit window (bottom right)
- Click Close in the edit window (top right)
What have we done here? If we’re ranking for a term in Google, but users haven’t searched for it on our site, we don’t need to see it in the table. The left join ensures you see all your site search data but only Search Console data for terms that match.
That’s why the order we selected the tables in for the blend was important. Clicking on the GA4 table first means it is listed on the left so we use a “left outer” join.
Now all you need to do is give your new table the dimension “Search Term (Cleaned)” and the metrics “Average position” and “Event count”. While you’re in the Chart Setup panel, you could also set a default date range—depending on the amount of search data you have, you might want to look at a month or even an entire quarter.
Interpreting the results to identify potential content gaps
The most important step is interpreting the newly blended data in order to act on it.
View your report and click on the “Event count” column header to see the site search terms that are most popular. (You could alternatively export the data at this stage and work on it in Excel or Google Sheets if you prefer.)
What you are looking for are terms that have a high level of site search but little or no organic ranking (a “null” average position means you aren’t ranking at all). These represent potential content gaps: terms you aren’t currently covering on your site that could gain you additional organic traffic.
Competition is still a consideration. It may be that you aren’t ranking for terms not because there is a content gap but because the terms are very broad and very competitive. In other words, just because your users are looking for a particular term on your site doesn’t mean it will be easy to rank for.
For example, this niche travel website receives a lot of site searches for countries such as “vietnam” and “mexico”. It’s unlikely they would ever rank highly for these very general terms, even with unique, quality content:
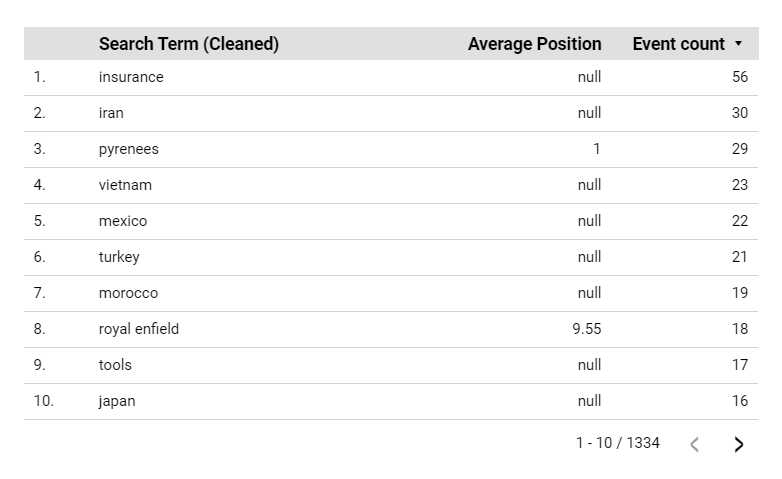
In this situation, you may be better identifying long-tail keywords with a smaller level of site search. For this travel website, that could be something like “estrada nacional 2”—a scenic road in Portugal. The site searches are lower, but the keyword will be much less competitive.
However, organic search traffic isn’t the only benefit of providing your users with the content they are looking for. You may be able to improve engagement or drive conversions with this content even if it doesn’t rank. Our travel website could create content for the countries its users are interested in (if it hasn’t done so already). So don’t completely discount competitive terms.
This analysis of your site search data isn’t a one-off exercise but something you should carry out regularly, on a quarterly or even monthly basis. Wider trends in the marketplace might cause new site search terms to bubble up to the top—and, of course, you’ll want to monitor the impact of any new content you’re creating.